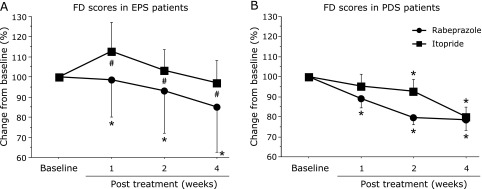
Fig. 5.
Comparison of percentage change in FD scores between treatment groups from baseline to post treatment for subjects with EPS (A) and PDS (B). FD, functional dyspepsia; RPZ, rabeprazole; ITO, itopride; EPS, epigastric pain syndrome; PDS, postprandial distress syndrome. *p<0.05, comparison with baseline for each group. #p<0.05, comparison between groups. Data are given as mean ± SD.

