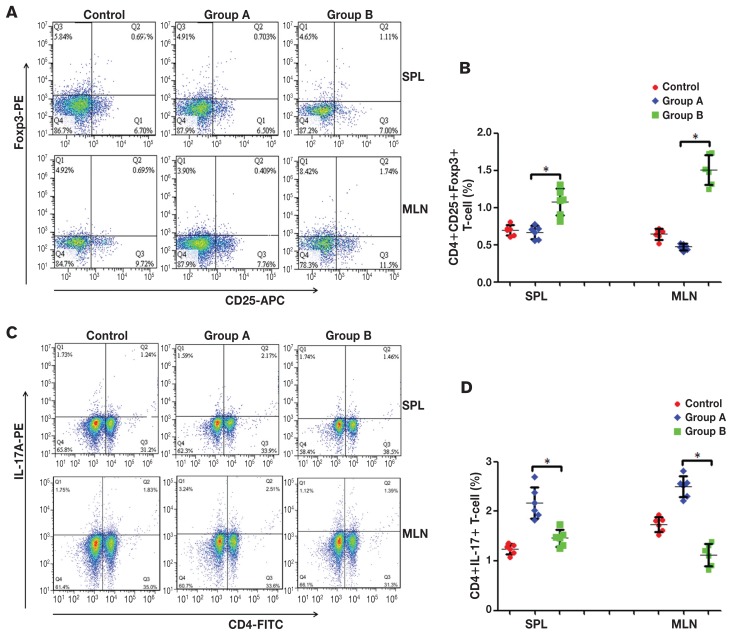
Figure 2.
Percentages of CD4+CD25+Foxp3+ Tregs and CD4+IL-17A+ Th17 cells in CD4+ T-cells. A — Representative flow cytometric analysis results of CD4+CD25+Foxp3+ Tregs in mouse spleen and lymph nodes. B — The frequency of CD4+CD25+Foxp3+ Treg in each group. a P < 0.05. C — Representative flow cytometric analysis results of CD4+IL-17A+ Th17 cells in mouse spleen and lymph nodes. D — The frequency of CD4+IL-17A+ Th17 cells in each group. a P < 0.05. Control: control group, the mice were administered normal saline. Group A: enteritis group, the mice were administered 0.2 mL 2.0 × 10⁸ cfu/mL ETEC K88 daily for 3 d. Group B: intervention group, the mice were administered 2.0 × 10⁸ cfu/mL L. casei for 7 d, then 2.0 × 10⁸ cfu/mL ETEC K88 for 3 d. Results are expressed as mean ± SD of 6 mice from each group.

