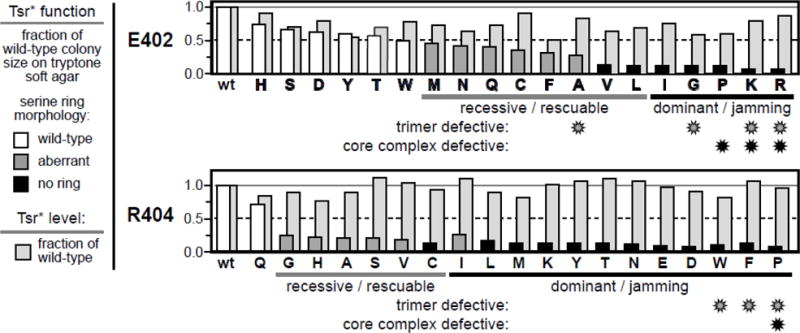
Fig. 2. Chemotaxis functions and expression levels of Tsr-E402* and Tsr-R404* mutants.

Properties of pCS53-E402* derivatives (upper panel) and pCS53-R404* derivatives (lower panel) are indicated by histogram bars that show performance relative to wild-type Tsr from pCS53. Amino acid replacements are denoted in single-letter notation; wt = wildtype. Bars in front indicate the chemotactic ability, assessed as colony size on tryptone soft agar plates (see Methods), of strain UU2612 (R+B+) carrying each mutant plasmid. Colony morphologies were classified based on the presence or absence of a chemotactic ring of cells at the colony border: wild-type (white), aberrant (dark gray), or no ring (black). The light gray histogram bars in back indicate the steady-state intracellular levels of the mutant proteins relative to the wild-type in strain UU2610 (R−B−) (see Methods). The functional defects of null and aberrant mutants (dominant or recessive in complementation tests; rescuable or jamming in epistasis tests; see Methods) are indicated below the oneletter codes for the mutant amino acid replacements. Mutant receptors that exihibited substantial defects in trimer-of-dimer formation (in TMEA crosslinking tests; see Methods) and/or in core complex formation (fluorescence light microscopy assays; see Methods) are identified with gray or black asterisks, respectively (see Fig. S1 and Tables S1 & S2). To facilitate comparisons of mutant behaviors each panel has a solid gray line at 1.0 and a dashed black line at 0.5 of the wild-type values.
