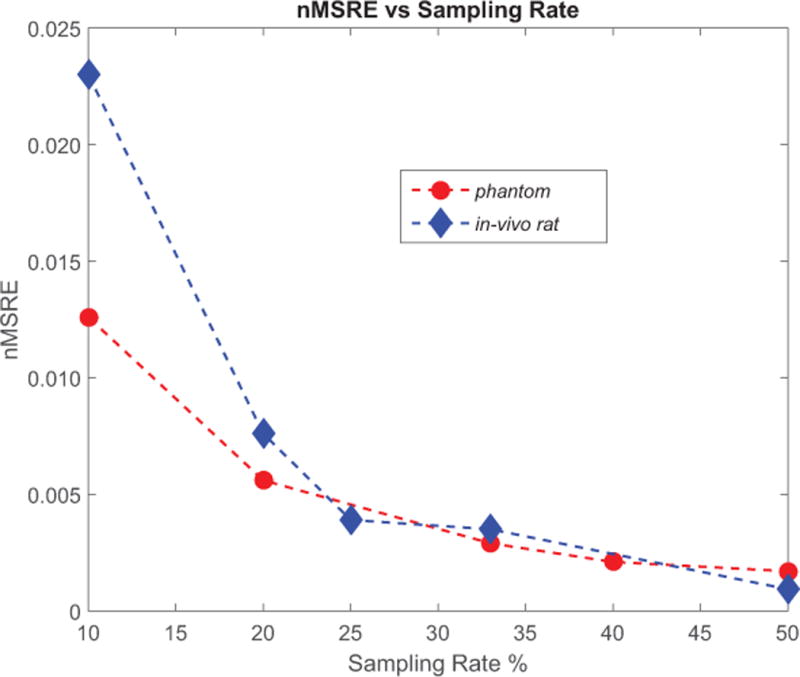
Figure 3.

Normalized root-of-mean-square error (nRMSE) of compressed sensing reconstructed CSI as function of artificially under sampled data; red dots represent that of the 4-metabolite phantom and the blue diamond the in-vivo rat scanning. The low nRMSE values for reduction rate up to 5 (20% sampling rate) reflected the good quality of compressed sensing reconstructed phantom images in Figure 2 and the rat #1 kidney images in Figure 4.
