
Figure 5.
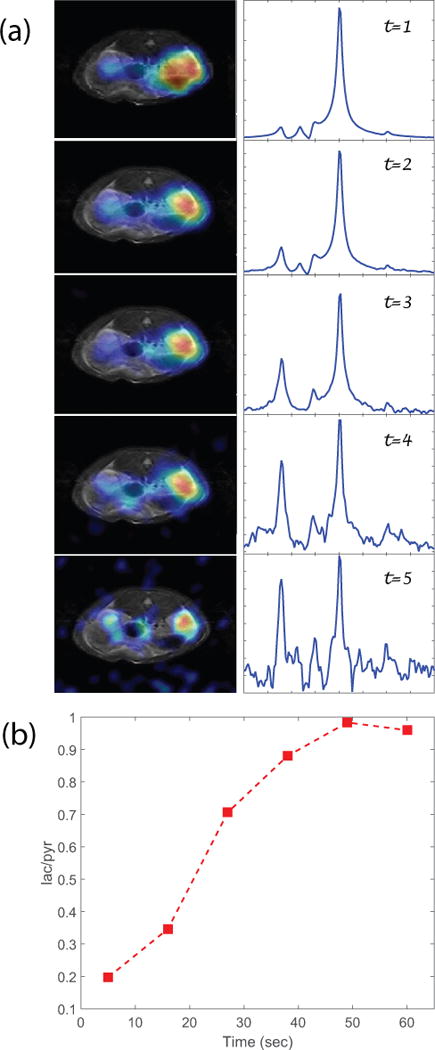
(a) Multi-phase CSI scans of R=3, left: lactate images; right: spectrum; shows the metabolic dynamics. With R=3, each 16×16 phase encoding CSI scan time of 11s. The spectra show evolution of the lactate-pyruvate ratio during the first minute; (b) Lactate to pyruvate ratio vs time from the multi-phase CSI. The intensity is the integration from the kidney area.