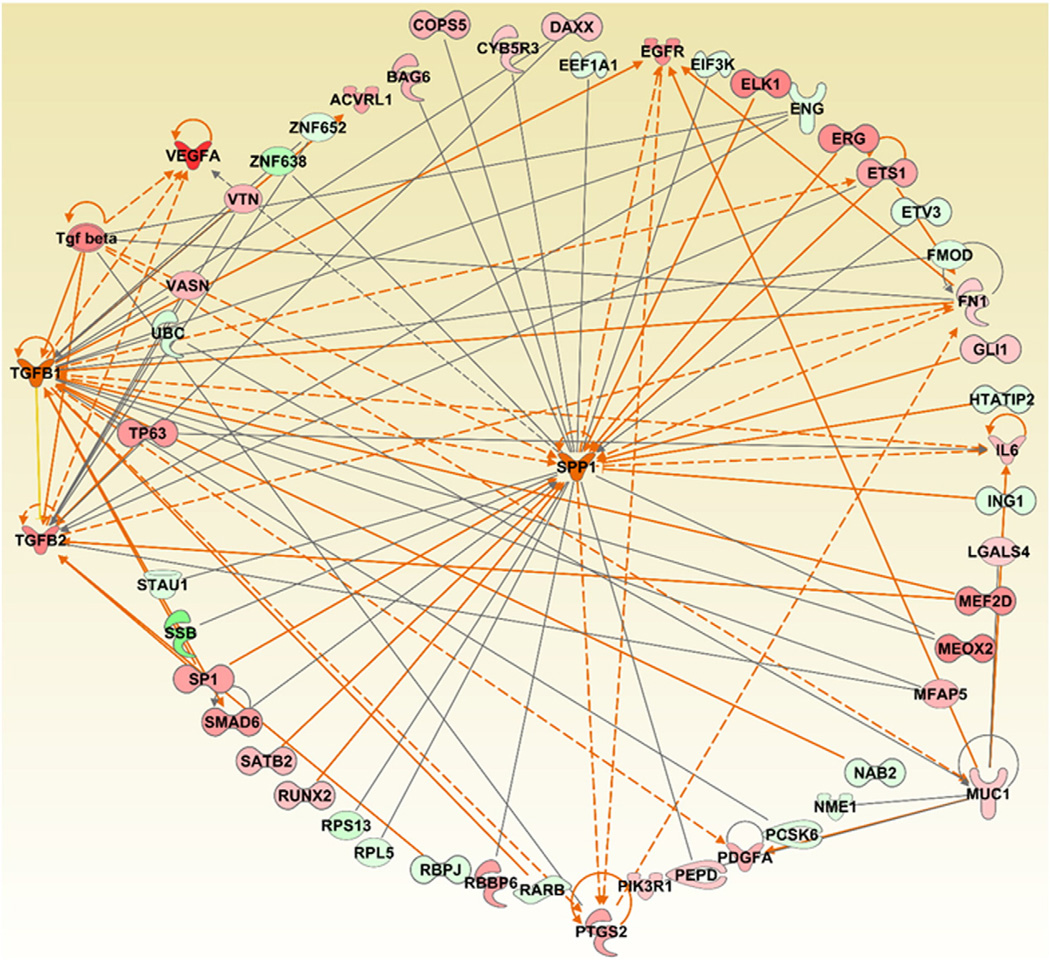
Fig. 2.
Gene centric network generation and analysis of the three pro-fibrotic markers (KL-6/MUC1, TGF-β1, SPP1), and their associated genes differentially expressed in whole blood samples of MWCNT exposed workers. The dataset corresponding to the whole blood gene expression profiles of MWCNT-exposed workers was downloaded from NCBI's Gene Expression Omnibus (GEO, http://www.ncbi.nlm.nih.gov/geo/) using the accession number: GSE73830. Red: Up regulated. Green: Down regulated. Orange and blue arrows represent activation and deactivation mechanisms that are consistent with the expression and/or predicted activation of the three pro-fibrotic markers. The Grow feature of the IPA pathway tool was used to construct and expand the network based on the various relationships between the selected molecules and other molecules in the given dataset based on their expression. Following this, the MAP pathway tool of IPA was used to determine and predict the upstream and/or downstream effects of activation or inhibition of the molecules in a generated network.

