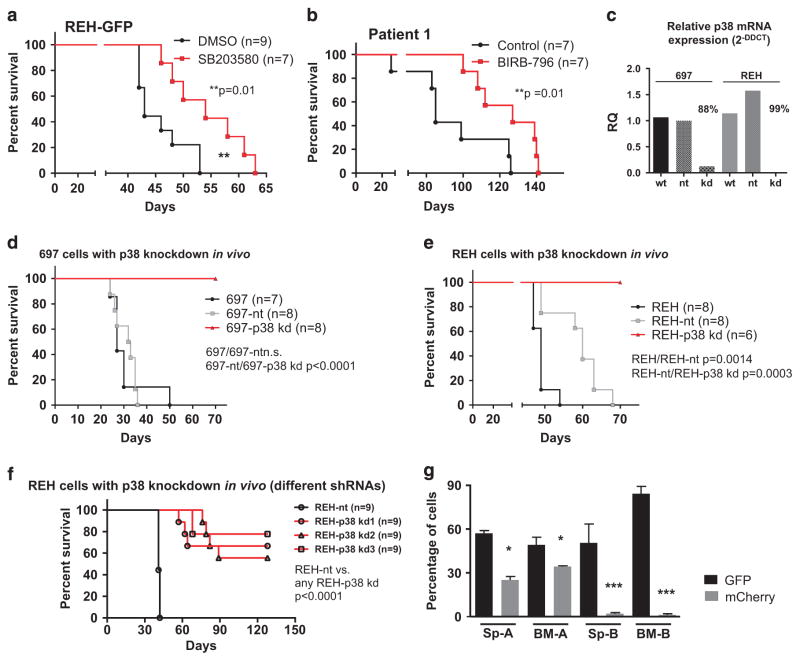
Figure 4.
In vivo effects of p38α/β inhibition. (a) 1 ×10⁵ REH-GFP cells/mouse were xenografted into NSG mice by tail vein injection. Animals were treated with 10 mg/kg SB203580 or DMSO 0.1% as vehicle control by intraperitoneal administration every other day. The graph depicts the respective survival curves. Statistics were performed according to the Mantel–Cox log-rank method. (b) 1 × 10⁶ cells from primary xenografts of a p-p38α/βhigh patient were xenografted into secondary mice by intrafemoral injection. Animals were treated with 10 mg/kg BIRB-796 or ethanol 2% in a 0.5% (w/w) hydroxypropylmethylcellulose solution as vehicle control by oral gavage 5 days/week. The graph depicts the respective survival curves. Statistics were performed according to the Mantel–Cox log-rank method. (c) Relative p38 mRNA expression levels of two replicate analyses as measured by the 2-DDCT method. Cells were measured before injection into mice. Non-targeting small hairpin RNA (shRNA) against GFP (nt), shRNA against p38α (kd). Knockdown efficiency was calculated comparing nt and kd conditions. (d) 1 × 10⁴ 697 cells with and without a p38α knockdown were xenografted into NSG mice by intrafemoral injection as indicated. Animals were killed upon leukemic symptoms. The graph depicts the respective survival curves. Statistics were performed according to the Mantel–Cox log-rank method. (e) 2 × 10⁴ REH cells with and without a p38α knockdown were xenografted into NSG mice by tail vein injection as indicated. Animals were killed upon leukemic symptoms. The graph depicts the respective survival curves. Statistics were performed according to the Mantel–Cox log-rank method. (f) 5 × 10⁴ REH cells with and without a p38α knockdown (three further constructs, p38 kd(1), p38 kd(2) and p38 kd(3)) were xenografted into NSG mice by tail vein injection as indicated. Animals were killed upon leukemic symptoms. The graph depicts the respective survival curves. Statistics were performed according to the Mantel–Cox log-rank method. (g) 1 × 10⁴ 697-GFP and 1 × 10⁴ 697-nt (mCherry; group A) or 1 × 10⁴ 697-GFP and 1 × 10⁴ 697-p38α/β-kd (mCherry; group B) cells were mixed and simultaneously xenografted into eight NSG mice per group by intrafemoral injection. Animals were killed upon leukemic symptoms. The graph depicts the fluorescence of spleen (Sp) and bone marrow (BM) leukemic blasts in groups A and B as indicated.

