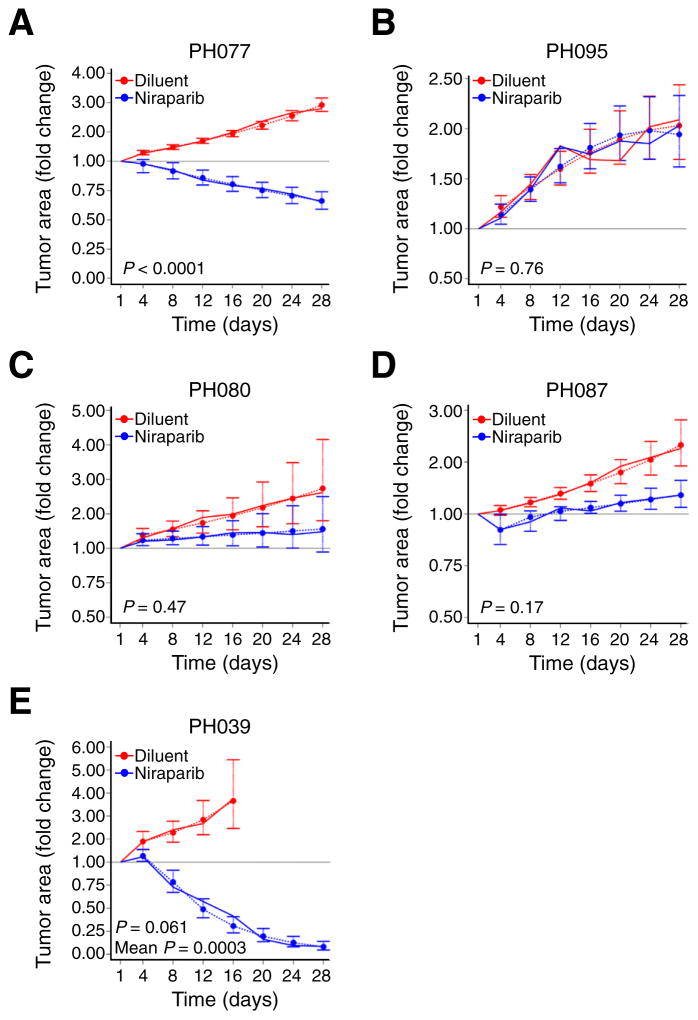
Fig. 2. Response of PDXs to single-agent niraparib.
Change in mean tumor area (solid lines) in niraparib treated (blue line) and control (red line) arms. Mean tumor area has been normalized to day 1 mean area as described in the statistical methods. p-Values for differences in growth trajectories in each PDX model are presented. Estimated (predicted) mean tumor areas together with standard error bars from the regression model are included for visual demonstration that the model fits the data well (dashed lines). “P” indicates test for different growth rates (slope), while “Mean P” indicates test for different average area (centered intercept).

