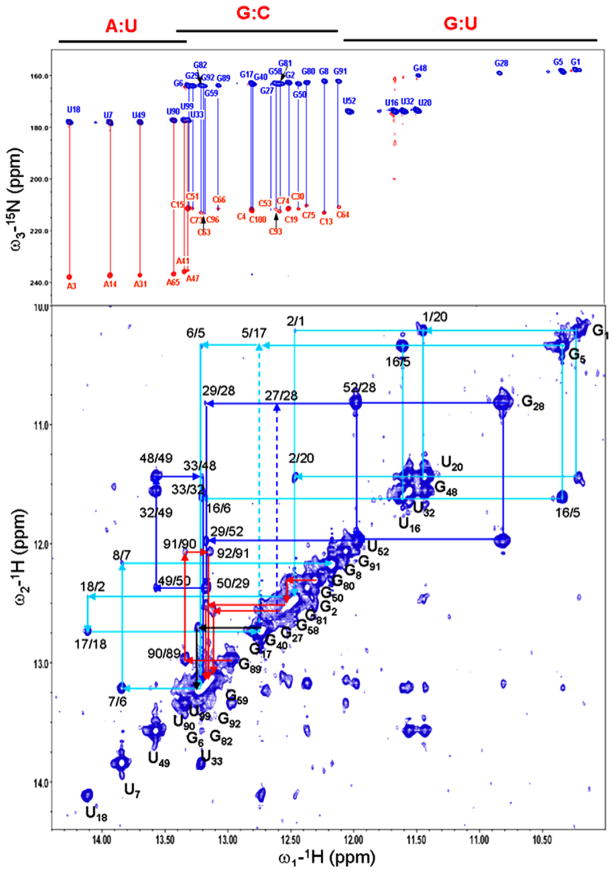
Fig. 3.
The HNN-COSY (top panel) and 2D imino NOESY (bottom panel) spectra of TCV RBSE. The NOESY spectrum was recorded at room temperature with a mixing time of 150 min. The imino walks in H1, H2, H3a, and H3b were marked in cyan, blue, red and black, respectively. The secondary structure of TCV RBSE is displayed in Figure 5a.

