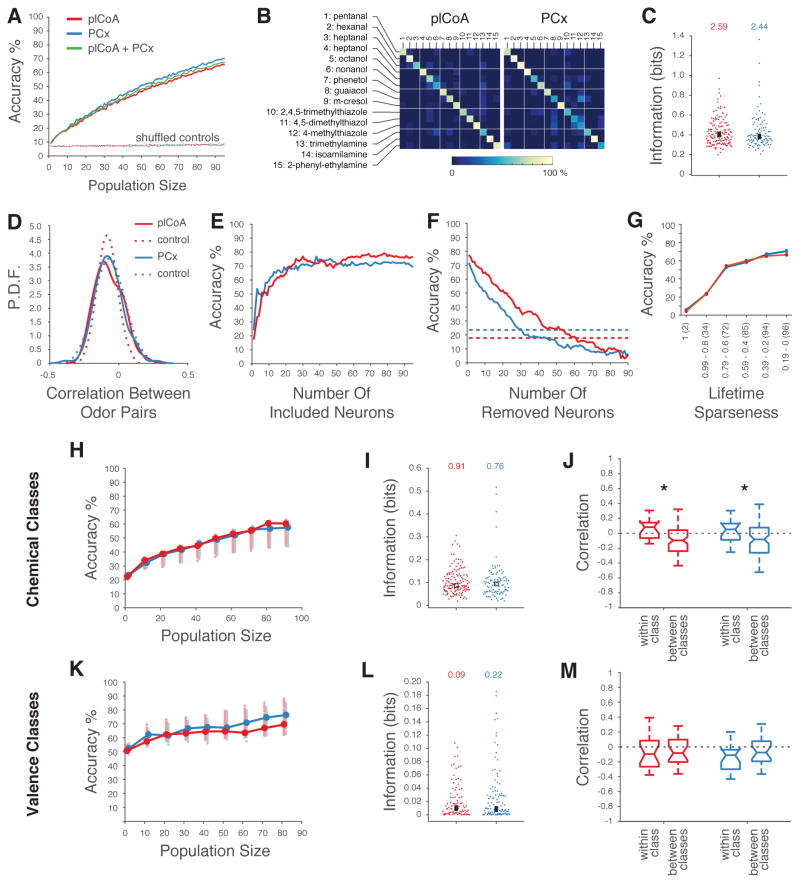
Figure 4. Decoding of Odor Identity from plCoA and PCx Population Activity.
A. Mean accuracy of linear decoders trained to discriminate 15 different monomolecular odors (see STAR Methods). Dashed curves indicate performance after shuffling odor labels for all trials. B. Confusion matrices based upon the linear classifier in A reveal no systematic confusions between odors. C. Distribution of mutual information about odor identity in individual neurons for 15 monomolecular odors in plCoA and PCx (see STAR Methods, no significant differences observed using a Wilcoxon rank sum test). The number indicated on top is the information content of the population; square box indicates the mean. D. Distribution of the pairwise correlation coefficients (Pearson’s r) between ensemble neural representations (using the average response for each neuron) for 15 odors in plCoA (red) and PCx (blue). Control distributions (dashed lines) were obtained by reshuffling odor labels 500 times for each neuron. E. Classification performances obtained after sorting neurons based on their informativeness about odor identity (highest to lowest, as in C.). F. Classification performances in which populations of 90 plCoA and PCx neurons were systematically depleted of neurons in order of their informativeness; dashed lines indicate the performance of the most informative single neurons in plCoA (red) and PCx (blue). Note the sharp initial drop in accuracy in PCx was caused by removing the two highly informative neurons depicted in figure 1C, followed by the equalization of the slopes of the decrementing curves. G. Classification performances obtained after sorting neurons based on their lifetime sparseness (highest to lowest). Note that the number of neurons added at each step was equal for both plCoA and PCx (total number of at each lifetime sparseness indicated within parentheses). H. Linear discriminator accuracies (as in A) of the chemical class of an odor, plotted as a function of the size of plCoA (red) and PCx (blue) populations. 15 odors were grouped in five classes based on their main chemical moiety (e.g., alcohols, aldehydes, amines, phenols, and thiazoles). Circles indicate means. Shaded circles indicate the mean accuracies obtained after randomly grouping the 15 odors in 5 arbitrary classes; this represents chance performance in this experiment. The performances for populations of 70, 80 and 90 plCoA neurons are just above the 97.5th percentile of the controls. I. Distribution of chemical class information in individual neurons across 15 odors in plCoA and PCx, with total population information indicated at the top, and with the box indicating the mean (no significant differences, Wilcoxon rank sum test). J. Pairwise correlation between population vectors representing two odors belonging to the same chemical class or to two different chemical classes. Medians are reported and whiskers represent the interquartile range (p<0.05, t-test). K.– M. Like H. – J. but with respect to odor valence.

