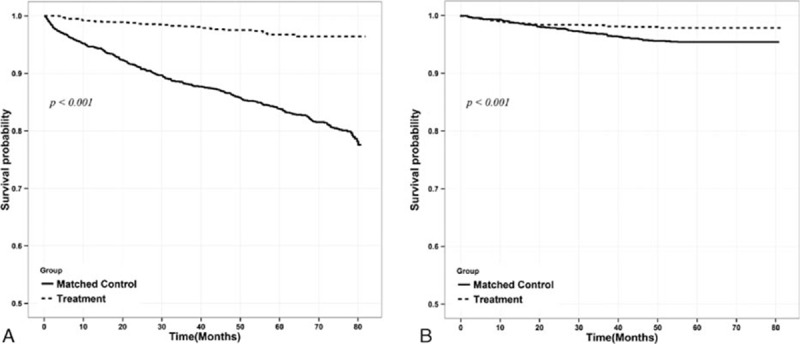
Figure 2.

Comparison of cumulative survival rate in the control group and transplant group for overall survival rate (A) and major adverse cardiac events (MACE) (B) after optimal balanced risk set matching. (A) Kaplan–Meier curves for the matched population including those in the control group (solid line) versus transplantation group (dashed line); (B) Kaplan–Meier curves for MACE in the matched population (solid line) versus transplantation group (dashed line). MACE: incidence of nonfatal myocardial infarction, hemorrhagic and ischemic stroke, coronary artery bypass graft surgery, or percutaneous coronary intervention.
