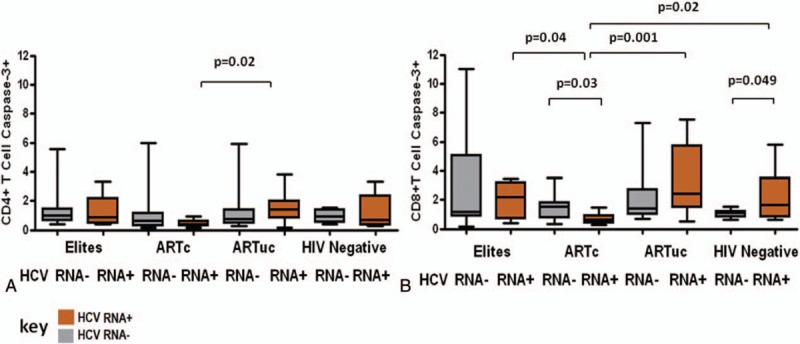
Figure 3.

CD8 T-cell Caspase-3 level varies with HCV viremia and is ameliorated in ARTc, Caspase-3 levels in HIV phenotypes by HCV RNA status. (A) CD4 T-cell Caspase-3 levels and (B) CD8 T-cell Caspase-3 levels in Elites, ARTc, ARTuc, and HIV negatives in HCV RNA+ and HCV RNA− groups. Boxes represent 25th, 75th percentiles of the distribution (interquartile range [IQR]) and whiskers represent minimum and maximum values. Median value is shown as the solid line. Significance as depicted, t test was used across HCV viremia subgroups and 1-way analysis of variance across HIV phenotypes.
