Fig. 2.

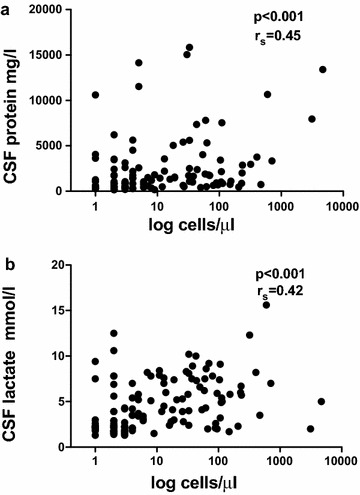
The CSF protein (n = 130) a and CSF lactate levels (n = 132) b correlated with the CSF cell counts (Spearman’s rank correlation coefficient rS = 0.45, p < 0.001 for CSF protein and rS = 0.42, p < 0.001 for lactate)

The CSF protein (n = 130) a and CSF lactate levels (n = 132) b correlated with the CSF cell counts (Spearman’s rank correlation coefficient rS = 0.45, p < 0.001 for CSF protein and rS = 0.42, p < 0.001 for lactate)