
Fig. 3.
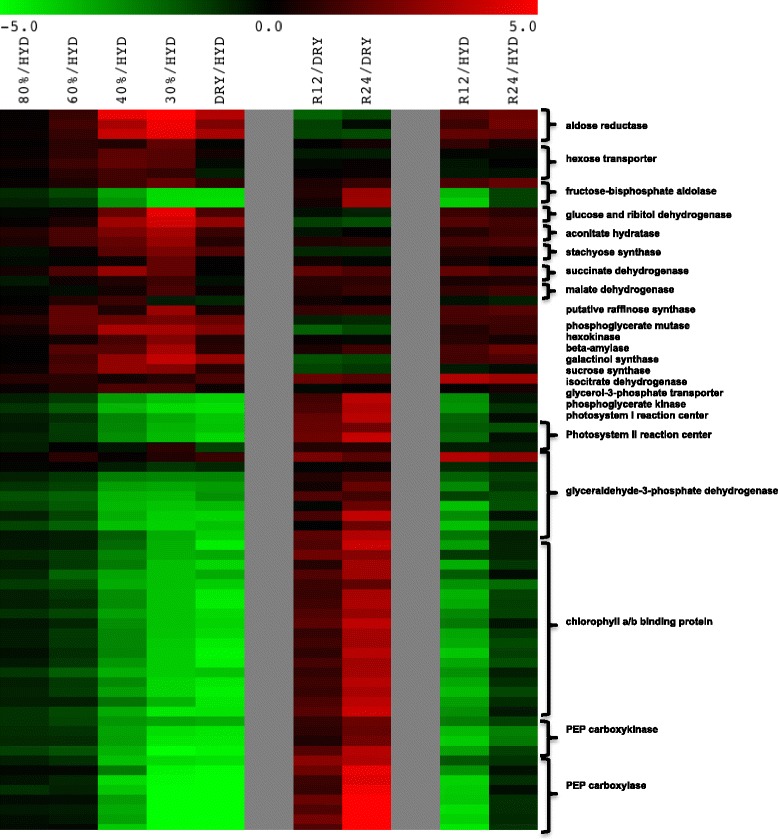
A heat map of SDATs encoding energy metabolism related transcripts young leaf tissues of S. stapfianus. Multi Experiment Viewer (MeV 4.8.1) was used to generate the clustering of the data based on fold change values (log2). The color code represents the ratio between dehydrated (80%, 60, 40, and 30% RWC) as well as the dry state [DRY] and the hydrated state [HYD] for the first 5 columns and between either 12 and 24 h rehydration and the dry state [DRY] or initial hydrated states [HYD]. Red shading indicates a positive value for the fold change and green shading indicates negative values for the fold change in transcript abundance. Black indicates no change in transcript abundance