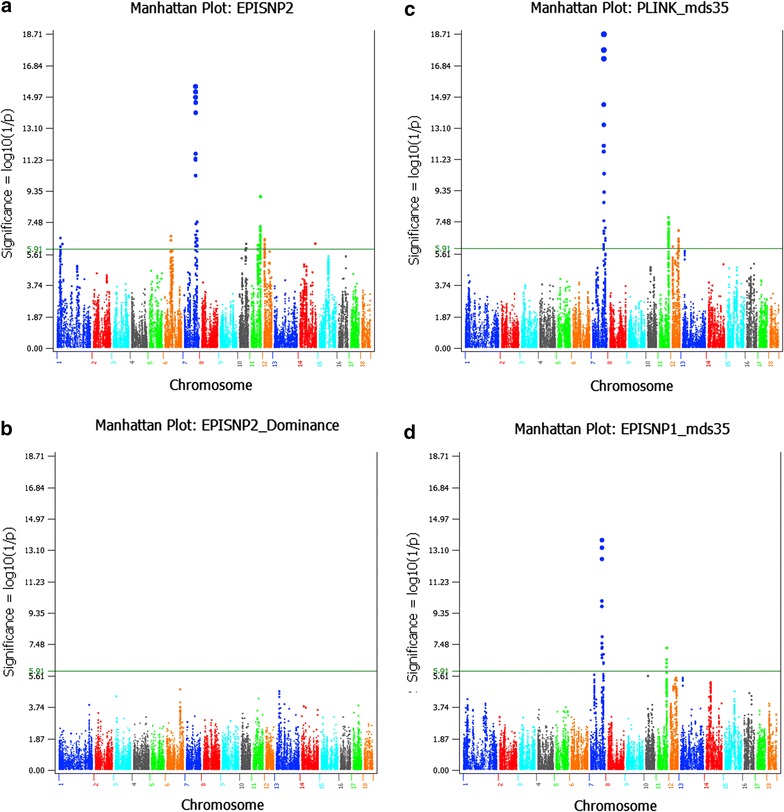
Fig. 3.

Manhattan plots from three methods of genome-wide association analysis. a Manhattan plot of p values for testing additive SNP effects using the generalized least squares (GLS) analysis of EPISNP2. b Manhattan plot of p values for testing dominance SNP effects using the generalized least squares (GLS) analysis of EPISNP2. c Manhattan plot of p values for testing additive SNP effects using the least squares (LS) analysis of PLINK with the first 35 dimensions of multidimensional scaling (MDS) as fixed effects. d Manhattan plot of p values for testing additive SNP effects using the LS analysis of EPISNP1 with the first 35 MDS dimensions as fixed effects. The horizontal green line indicates the genome-wide significance with the Bonferroni correction (p < 10−5.91). All p values in the figures are in log(1/p) scale
