
Fig. 2.
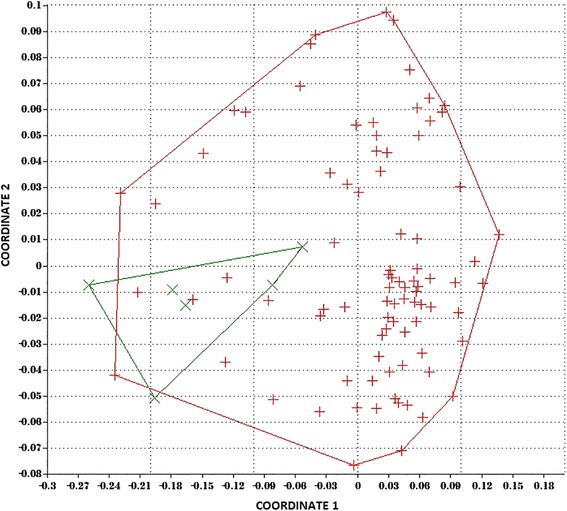
Multidimensional scaling plot demonstrating differences between patients (red) and controls (green) in expression of all miRNAs examined (analysis of similarity test R = 0.315; p = 0.002)
Official websites use .gov
A
.gov website belongs to an official
government organization in the United States.
Secure .gov websites use HTTPS
A lock (
) or https:// means you've safely
connected to the .gov website. Share sensitive
information only on official, secure websites.
Multidimensional scaling plot demonstrating differences between patients (red) and controls (green) in expression of all miRNAs examined (analysis of similarity test R = 0.315; p = 0.002)