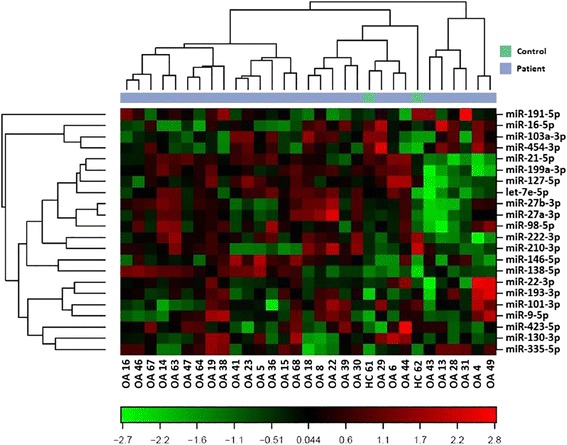
Fig. 3.

Unsupervised hierarchical clustering of differentially expressed miRNAs in the cartilage of the healthy controls and OA patients. Clustering was performed in all samples. Each row represents one miRNA, and each column represents one sample. The miRNA clustering tree is shown on the left. Normalized (dCq) values were used in the analysis. The colour scale illustrates the relative level of miRNA expression: red indicates expression level above the mean (315 times), green represents expression level below the mean (367 times)
