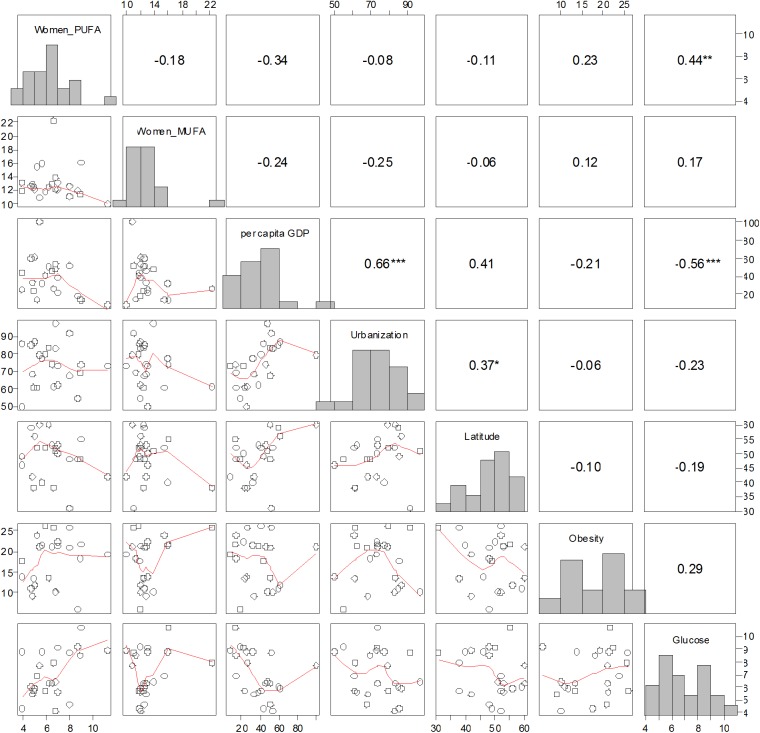
Fig 3. Scatterplot matrix depicting bivariate relationships between all response and independent variables for 25+ years female women across 23 European countries.
For descriptions of variable names and raw data, please see Table 2. Numbers in the upper diagonal represent Spearman rank correlation coefficients (* P ≤ 0.10; ** P ≤ 0.05; *** significant at Bonferroni-adjusted alpha, i.e. P ≤ 0.1 ÷21 ≈0.005). Lines in lower diagonal panels represent locally weighted smoothers. Histograms of each variable are included in the diagonal.

