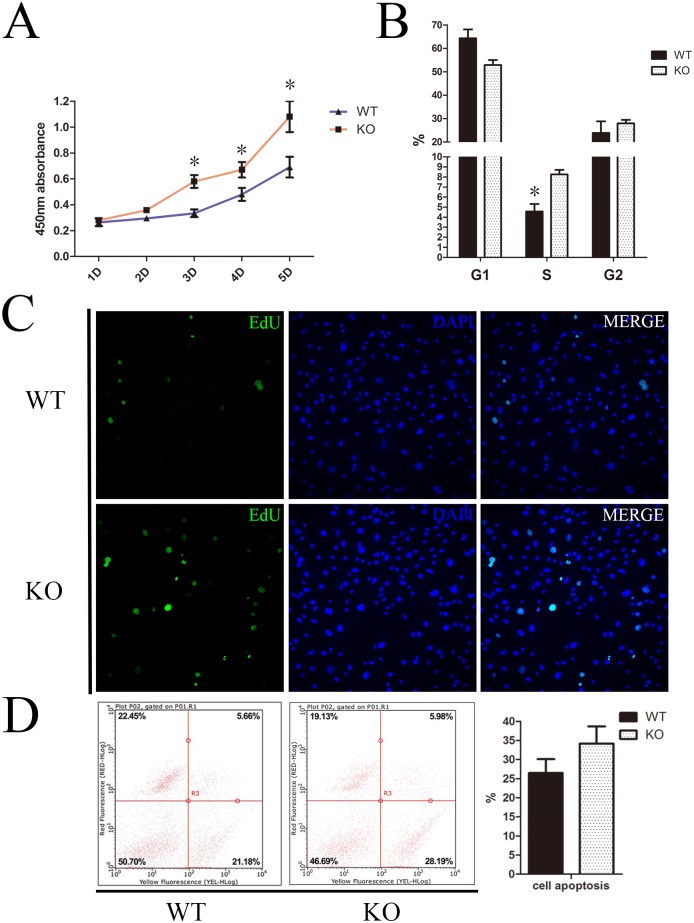
Fig 4. Sirt6 negatively regulates the proliferation of DMCs.
(A) The growth curves of the DMCs indicate that the proliferation of DMCs at day 3–5 was significantly greater in Sirt6 KO group that than which occurred in the WT group. (B) Flow cytometry analysis revealed that 8.58% of the Sirt6 KO cells and 4.94% of Sirt6 WT cells were in the S phase. This difference was statistically significant. (C) An EdU incorporation assay confirmed that the proliferation of DMCs increased significantly in the Sirt6 KO group at day 4. (D) There was no statistically significant difference in the rate of cell apoptosis between the two groups. *p<0.05 versus CO; CO = control; n = 3; Error bars shown represent the SD.

