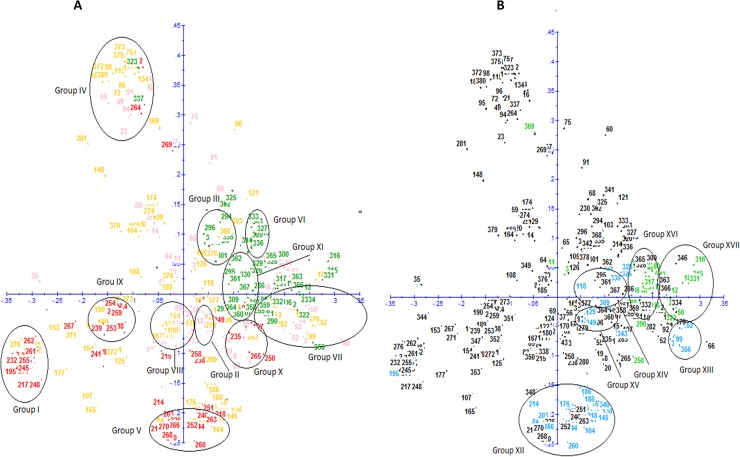
Fig 1A. Diagram showing the relationships among 367 accessions of D. alata based on Principal Coordinate Analysis (PCoA) using 24 microsatellites.
Clones originated from Vanuatu are colored in green and those from CTCRI (India) in red. The accessions of the CRB-PT and the IITA are colored in orange and pink, respectively. 1B. Diagram showing the relationships among 83 polyploid accessions of D. alata based on Principal Coordinate Analysis(PCoA) using 24 microsatellites. Tetraploids accessions are colored in green and triploids in blue.

