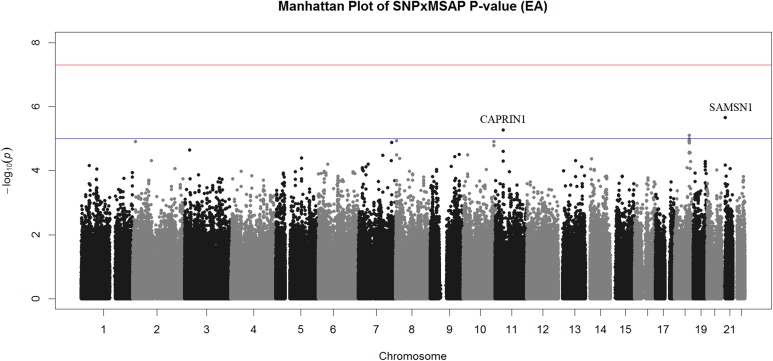
Fig 2. Manhattan Plot of Interaction P-values for EA GWIS.
Manhattan plot of interaction P-values for the EA GWIS. Though no interactions achieved genome-wide significance (red line) interactions on chromosome 11 (CAPRIN1), 18, and 21 (SAMSN1 open chromatin region) exceeded the suggestive significance threshold (blue line).

