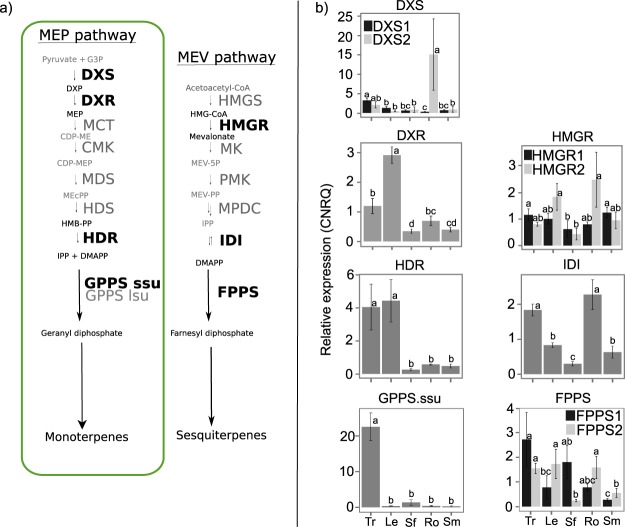
Fig 2. Schematic of the plastidial methylerythritol phosphate pathway (MEP) and mevalonic acid pathway (MEV) and transcript abundance in different parts of cannabis.
Steps shown in bold (a) were included in the qPCR analysis (b) of relative abundance of transcripts. Letters indicate significantly different means between tissues (tested within each gene), Fisher’s LSD (alpha = 0.05). Abbreviations: Tr = trichome; Le = leaf; Sf = stamenate flower; Ro = root; Sm = stem.

