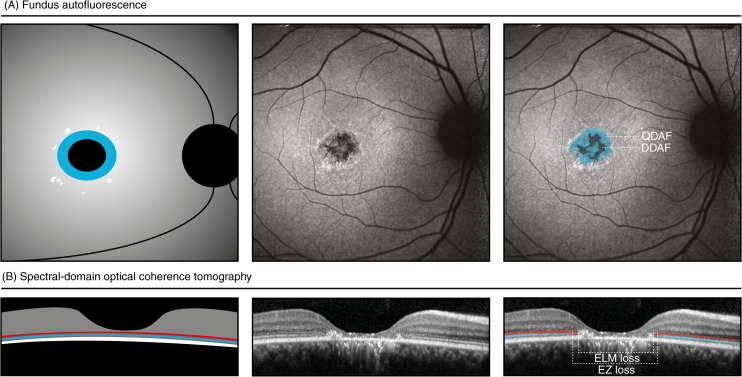
Fig 2. Schematic and representative images of measurements in fundus autofluorescence imaging and spectral-domain optical coherence tomography.
Patient 9: area of questionably decreased autofluorescence (QDAF, blue), 1.37 mm2; area of definitely decreased autofluorescence (black), 0.33 mm2; transverse loss of external limiting membrane (ELM-loss, red), 1.75 mm, transverse loss of ellipsoid zone (EZ-loss, blue), 2.24 mm; best-corrected visual acuity, 20/100; ABCA4 variants, c.1622T>C;3113C>T:p.[Leu541Pro;Ala1038Val] and c.6316C>T:p.(Arg2106Cys).

