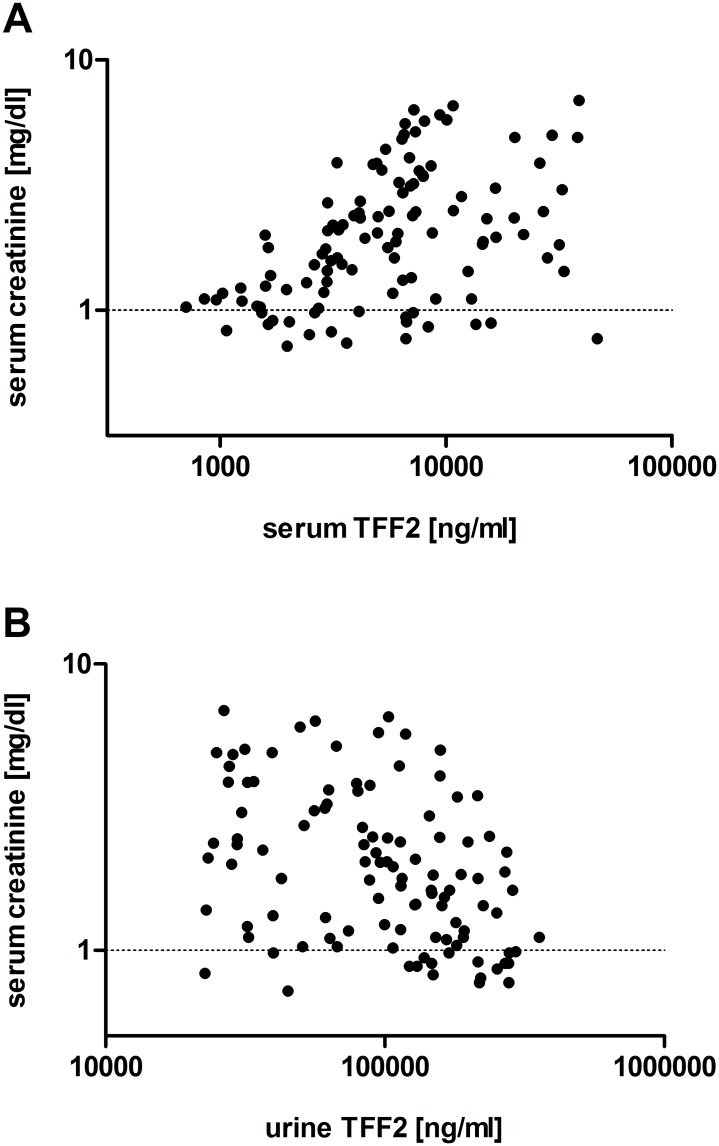
Fig 2. Correlations.
Panel A: Serum TFF2 and serum creatinine correlated significantly using Spearman's rank correlation coefficient (Spearman's r = 0.44, p < 0.001, 113 pairs). The X and the Y-axis are given as log scale. Panel B: Urine TFF2 and serum creatinine negatively correlated using Spearman's rank correlation coefficient (Spearman's r = 0.4, p < 0.001, 111 pairs). The X and the Y-axis are given as log scale.

