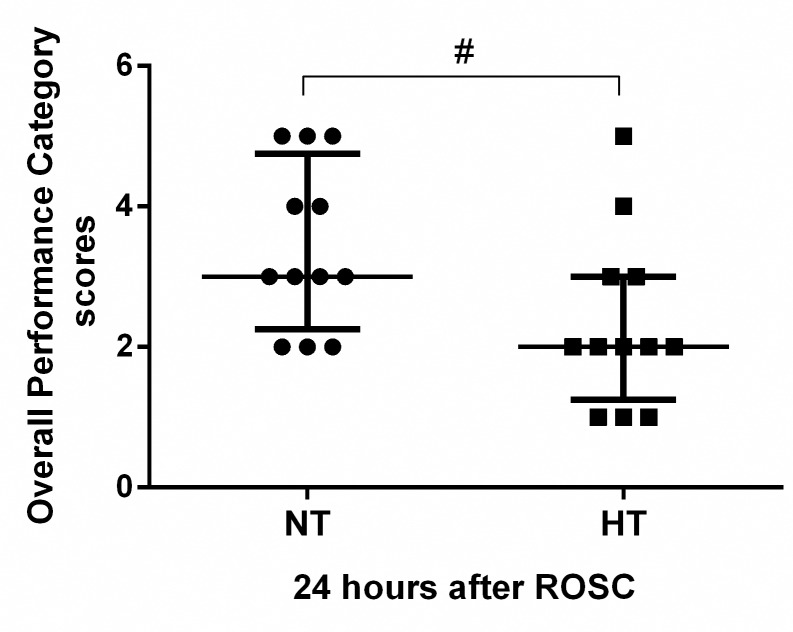
Fig 2. Overall performance category scores.
Neurologic outcome was evaluated based on Overall Performance Category scores in the NT (n = 12) and HT (n = 12) groups. A score of 1 represents normal, whereas a score of 5 indicates brain death. Values are given as the median ± interquartile range. ROSC, restoration of spontaneous circulation; NT, non-hypothermia group; HT, mild hypothermia group. #P<0.05 versus NT group.

