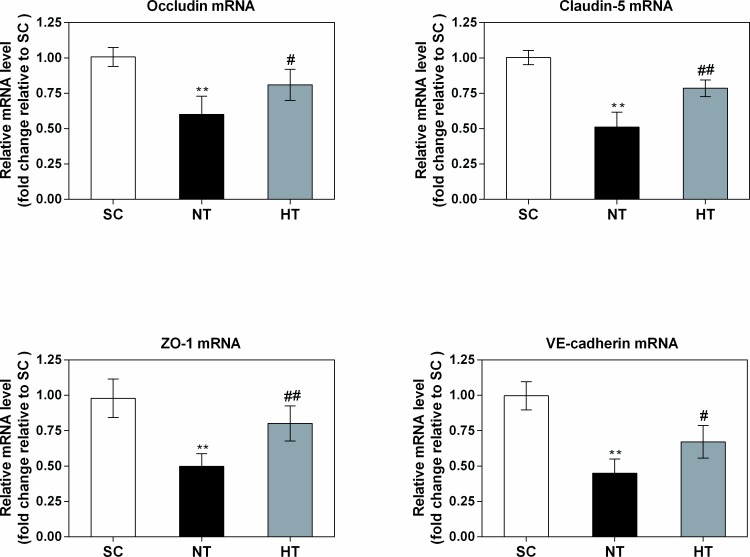
Fig 6. Occludin, claudin-5, ZO-1, and VE-cadherin mRNA expression in cortical tissues at 24 hours after CA.
The mRNA levels were quantified via real-time PCR in the SC (n = 4), NT (n = 5), and HT (n = 7) groups, and the data were normalized to GAPDH levels. The fold changes in occludin, claudin-5, ZO-1, and VE-cadherin mRNA expression were calculated relative to the expression levels in the SC group, and the results are presented as the mean fold changes ± sd relative to the SC group. SC, surgery control group; NT, non-hypothermia group; HT, mild hypothermia group. *P<0.05, **P<0.01 versus SC group; #P<0.05, ##P<0.01 versus NT group.

