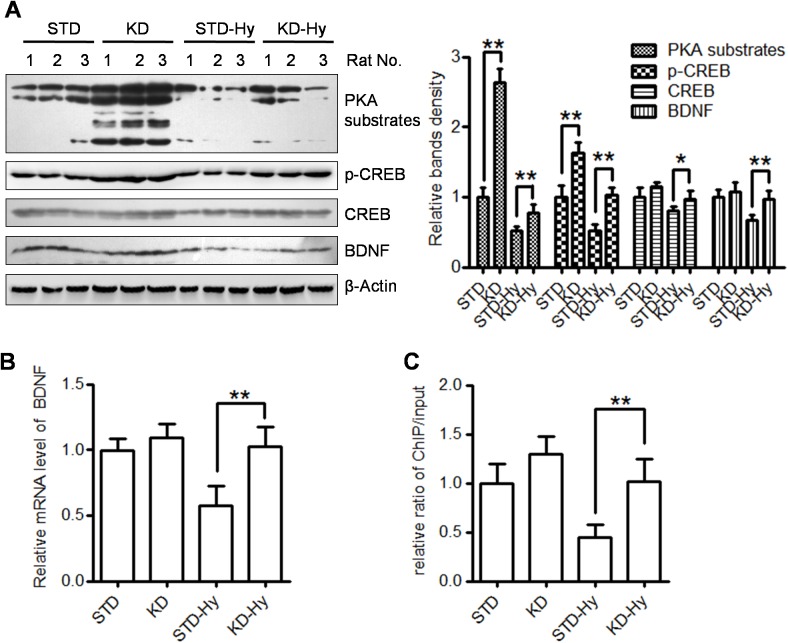
Fig 7. KD treatment promotes the PKA/CREB pathway and increase BDNF protein levels.
A. Protein levels of PKA substrates, p-CREB, CREB and BDNF, in the hippocampus were detected by western blot. The levels of β-actin serve as an inner control. Three rats in each group. The right bar graph shows the relative band density of each protein in each group, and the data are shown as the means ± S.E. (* p<0.05, ** p<0.01). B. Quantitative realtime PCR of BDNF gene expression in the four groups. Data are expressed as means ± S.E, and normalized to the STD group (** p<0.01). C. ChIP-PCR were performed to measured the binding of acetylated histone H3 (Lys9/14) to the promoter I of BDNF gene. Threshold amplification cycle numbers (Ct) were used to calculate IP DNA quantities as % of input control. Data are expressed as means ± S.E, and normalized to the STD group (** p<0.01).

