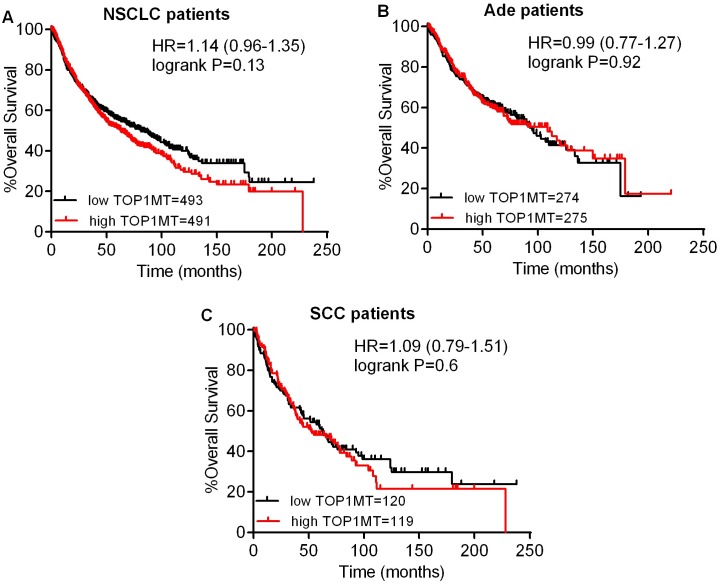
Fig 3. The prognostic value of TOP1MT expression.
(A) Survival curves were plotted for all NSCLC patients (n = 984). (B) Survival curves were plotted for Ade patients (n = 549). (C) Survival curves were plotted for SCC patients (n = 239). Data was analyzed using Kaplan-Meier Plotter. Patients with expression above the median are indicated in red line, and patients with expressions below the median in black line. HR means hazard ratio.

