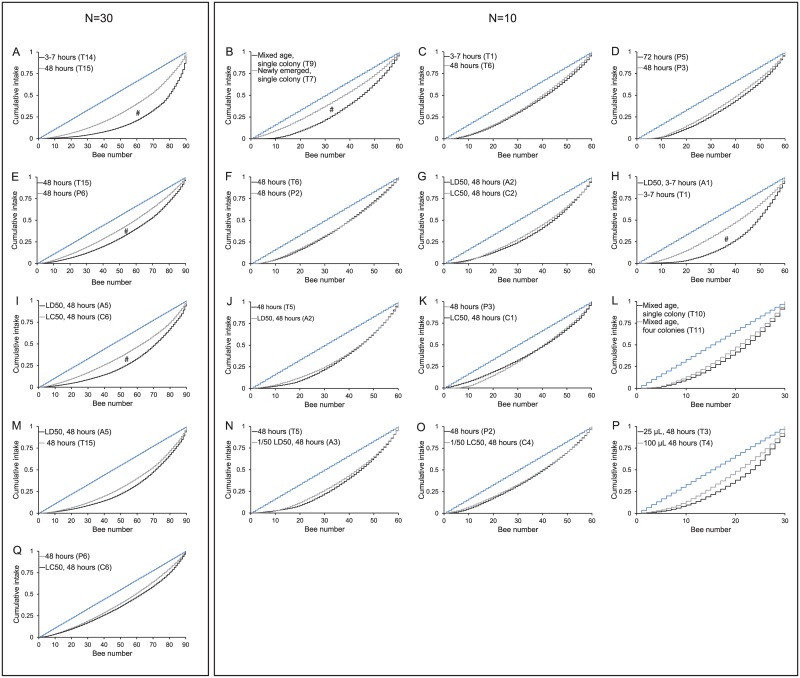
Fig 3. Comparison of cumulative intake of sugar diet between different experimental setups for temporary1 (T) and permanent2 (P) feeding regimes without imidacloprid and for acute3 (A) and chronic4 (C) feeding regimes with imidacloprid.
Pooled data from replicates of the two different experimental setups are shown (grey and black) referring to an assumed theoretical uniform distribution (light blue). Left column shows all experimental setups with N = 30 bees per cage, right column shows all experimental setups with N = 10 bees per cage. # indicates statistically different distributions of food between experimental setups. All experimental setups were statistically different from theoretical uniform distribution. (Kolmogorov-Smirnov test p < 0.05).
1 temporary: test bees initially provided with defined amount (25μL/100μL) of 14C labelled diet, followed by unlabelled diet ad libitum for maintenance
2 acute: test bees initially provided with defined amount (25μL/100μL) of 14C labelled diet containing LD50 or 1/50 LD50 imidacloprid, followed by unlabelled diet ad libitum for maintenance
3 permanent: test bees provided with 14C labelled diet ad libitum
4 chronic: test bees provided with 14C labelled diet containing LD50 or 1/50 LD50 imidacloprid ad libitum

