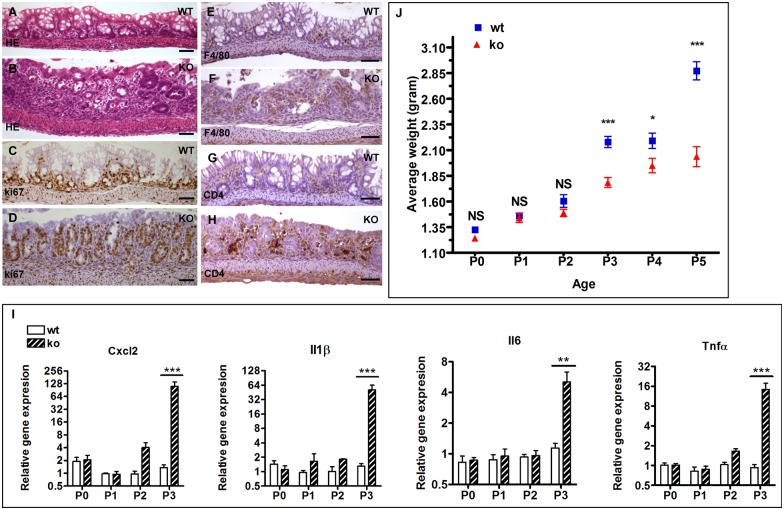
Fig 6. The IEC-specific hnRNPI knockout mice display colonic inflammation and weight gain decline at P3.
(A) and (B) HE–stained sections show the inflamed colonic epithelium in the knockout neonates (B). (C) and (D) Immunohistochemical staining with an anti-Ki67 antibody shows hyperproliferation of the colonic epithelial cells in the knockout neonates. (E) to (H) Immunohistochemical staining with indicated antibodies shows increased number of inflammatory cells in the lamina propria of the knockout neonates. (E) and (F) show macrophages, and (G) and (H) show CD4 positive T-cells. (I) Representative real-time PCR results show significantly increased expression of pro-inflammatory cytokines and chemokines in the knockout colon at P3. Data are presented as mean values relative to Gapdh (± s.e.m). N = 3–5 mice per group. Mice of the knockout group and the wild-type group are sibling littermates. Mice from at least 3 litters were tested at each age. (J) Starting at P3, the knockout neonates display decline in the weight gain. Each age contains at least 6 litters, and total 47 litters of 367 mice were analyzed. Data are presented as mean values ± s.e.m. * p < 0.05; ** p < 0.01; *** p < 0.001; NS, not significant. WT, wild-type; KO, knockout. Scale bars, 50 μm.

