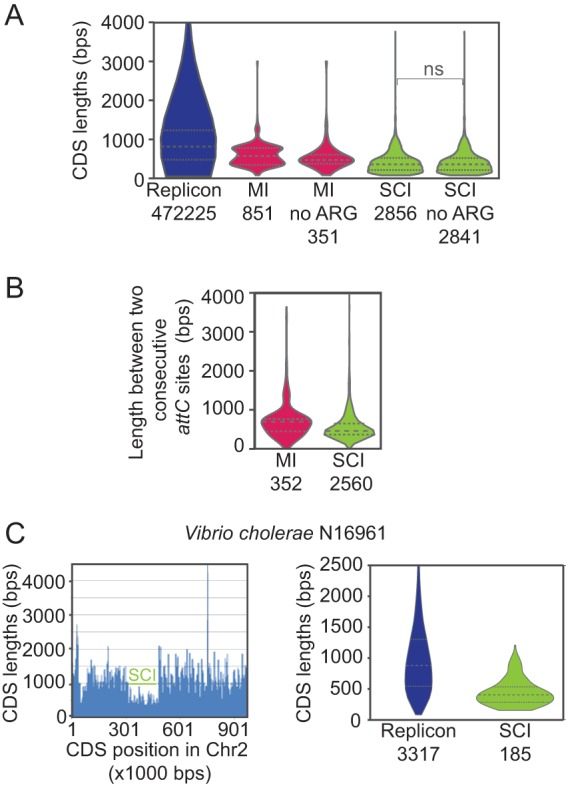
FIG 3 .

Cassette and coding sequence (CDS) length analysis. The length of the CDS in replicons, mobile integrons (MI), and sedentary chromosomal integrons (SCI) with and without antibiotic resistance genes (ARG) is shown in base pairs (bps). The numbers below each violin diagram refer to the total number of CDSs or cassettes analyzed. (A) Violin plots showing the distribution of CDS lengths for replicons, MIs, and SCIs (excluding ARGs or not excluding ARGs). Tests of the differences between data sets were performed using the Wilcoxon rank sum test. Differences are significant (P values of <10−6), except between the two rightmost violin plots (differences between CDS lengths of all SCIs and SCIs excluding ARGs or not excluding ARG). ns, not significant. (B) Violin plots showing the distribution of lengths between two consecutive attC sites for MIs and SCIs. Tests of the differences between data sets were performed using the Wilcoxon rank sum test. Differences are significant (P values of <10−6). (C) CDS length analysis of the Vibrio cholerae N16961 strain. (Left) CDS lengths as a function of their positions in chromosome 2 (Chr2). The horizontal green bar indicates the position of the SCI. (Right) Violin plots showing the distribution of CDS lengths for the two replicons and the SCI. Tests of the differences between data sets were performed using the Wilcoxon rank sum test. Differences are significant (P values of <10−6).
