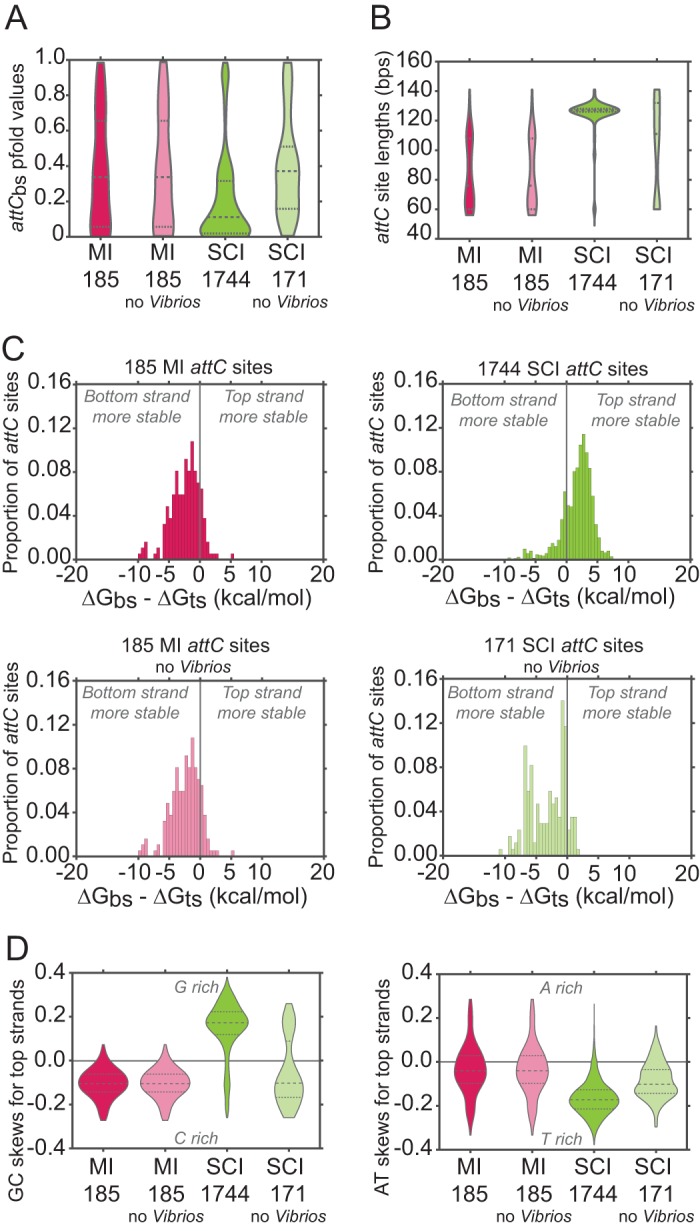
FIG 4 .

Analysis of 185 mobile integron (MI) and 1,744 sedentary chromosomal integron (SCI) attC site properties. attC sites were identified by IntegronFinder (Materials and Methods). The numbers below each violin diagram refer to the total number of attC sites analyzed. bs, bottom strand; ts, top strand; bps, base pairs. (A) Violin plots showing the distribution of attCbs pfold values for MIs and SCIs, excluding Vibrio strains or not excluding Vibrio strains. attCbs pfold values were calculated with RNAfold program from the ViennaRNA 2 package (Materials and Methods). Tests of the differences between data sets were performed using the Wilcoxon rank sum test. Differences are significant (P values of <10−6), except between MI attC sites excluding Vibrio strains or not excluding Vibrio strains, and between SCI attC sites excluding Vibrio strains and MI attC sites (excluding Vibrio strains or not excluding Vibrio strains). (B) Violin plots showing the distribution of attC site lengths for MIs and SCIs, excluding Vibrio strains or not excluding Vibrio strains. Tests of the differences between data sets were performed using the Wilcoxon rank sum test. Differences are significant (P values of <10−4) except between MI attC sites excluding Vibrio strains or not excluding Vibrio strains. (C) Proportion of attC sites as a function of the difference in ΔG between bottom and top strands (ΔGbs − ΔGts) for MIs and SCIs, excluding Vibrio strains or not excluding Vibrio strains. ΔG values (in kilocalories per mole) were calculated with RNAfold program from the ViennaRNA 2 package (Materials and Methods). (D) Violin plots showing the distribution of GC and AT skews calculated for the top strands of the attC sites for MIs and SCIs, excluding Vibrio strains or not excluding Vibrio strains. GC and AT skews were calculated as described in Materials and Methods. Negative skews correspond to an enrichment of purines (guanines [G] or adenines [A]) on the bottom strands. C, cytosine; T, thymine.
