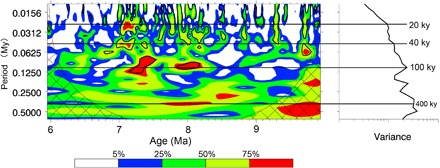
Fig. 5. The wavelet transform (87) (left) and the power spectrum (right) of the χfd/HIRM record from the Qaidam Basin.

The color scale indicates power, which is scaled to percent total power, and the hatched areas illustrate the cone of influence and, hence, the edge effects of the transform. We note that warm color indicates larger power. The 400-, 100-, 40-, and 20-ky periodicities are labeled and indicated by the straight black lines. The black contour is the 20% significance level, using a red noise background spectrum.
