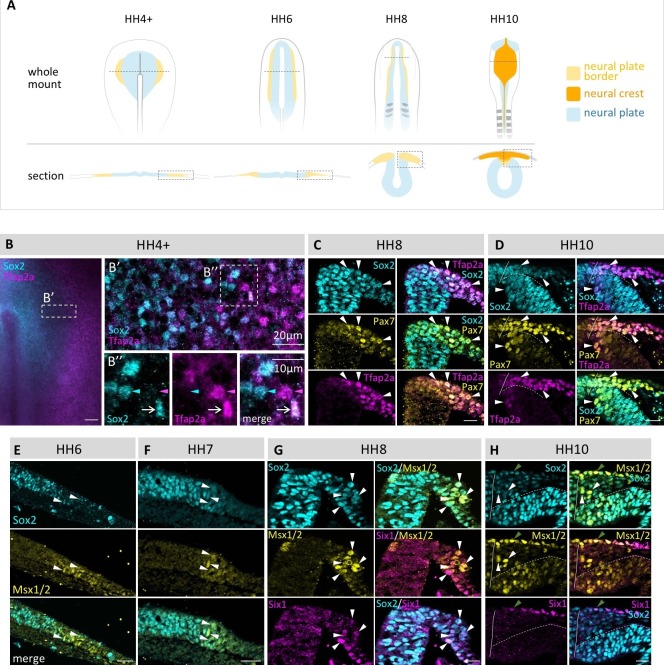
Figure 1. Coexpression of multiple transcription factor proteins in individual chick neural plate border (npb) cells as assayed by immunostaining at different developmental stages.
(A) Schematic diagrams of chicken embryos at different developmental stages from gastrulation to neurulation. Dashed line in whole mount indicates level of section. Dashed boxes indicate area displayed in (B–H). (B–B’’) Sox2 and Tfap2a in whole mount embryo at HH4+. (B’) Confocal image of npb (white box in B) shows Sox2 (blue) on medial (left) side and Tfap2a (magenta) on lateral (right) side of npb. B’’ zoom of box in B’ shows an example of a cell coexpressing Sox2 and Tfap2a (arrow) as well as a cell expressing either Sox2 (blue arrowhead) or Tfap2a (magenta arrowhead) only. (C–D) Transverse sections of embryos at HH8 to HH10 with co-immunostaining for Sox2 (blue), Tfp2a (magenta) and Pax7 (yellow). Arrowheads indicate examples of cells coexpressing all three markers. (E–F) Transverse sections of embryos at HH6 to HH7 with co-immunostaining for Sox2 (blue) and Msx1/2 (yellow). Arrowheads indicate examples of cells coexpressing both markers. (G–H) Transverse sections of embryos at HH8 and HH10 with co-immunostaining for Sox2 (blue) and Msx1/2 (yellow) and Six1 (magenta). Arrowheads in (G) indicate examples of cells coexpressing all three markers. White arrowheads in (H) indicate cells coexpressing Sox2 and Msx1/2 and green arrowhead indicates cell in epidermis co-expressing all three markers. All sections are oriented with medial to left and lateral to right side. Scale bars in wholemounts = 100 µm in sections = 20 µm (except 1B’’ = 10 µm).

