. 2017 Mar 29;6:e21620. doi: 10.7554/eLife.21620

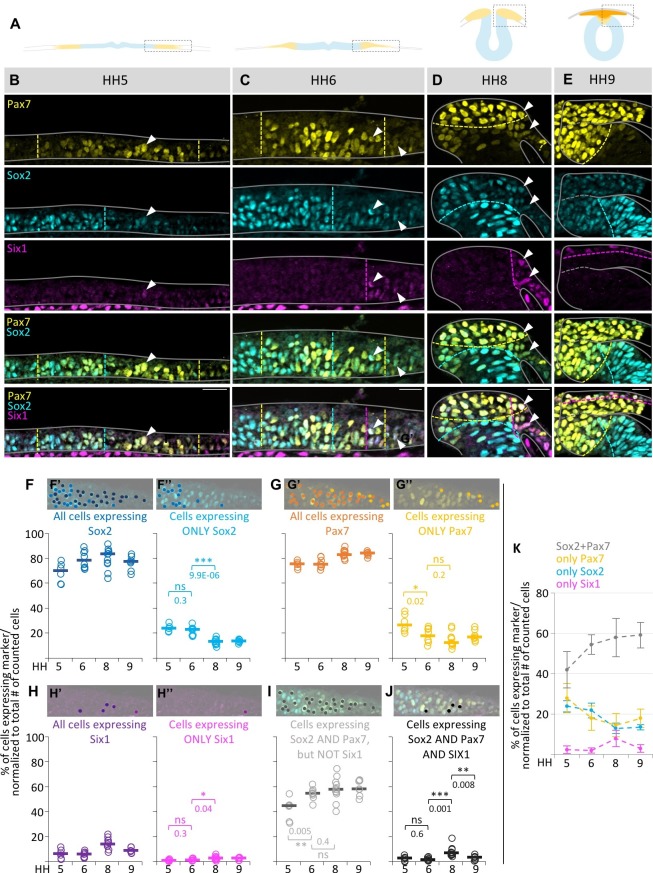
Figure 2. Quantification of marker (co-) expression in single cells.

(A) Schematic diagrams of sections staged accordingly to those used in (B–E). Box indicates area that was imaged in (B–E). (B–E) Transverse sections immunostained for Pax7 (yellow), Sox2 (blue) and Six1 (magenta) at HH5 (B), HH6 (C), HH8 (D) and HH9 (E). Grey lines outline the embryo borders. Dashed colored lines indicate borders between strong and weak/no expression of corresponding markers. Sections are oriented medial (left) to lateral (right). See also Figure 2—figure supplement 1. (F–H) Scatterplots of quantification of all cells that express Sox2 (F’), Pax7 (G’) and Six1 (H’) and the fraction of cells expressing only Sox2 (F’’), Pax7 (G’’) or Six1 (H’’) at HH5 to HH9. (I) Scatterplots representing the fraction of cells that coexpress Sox2 and Pax7, but not Six1 or (J) Sox2, Pax7 and Six1 at HH5 to HH9. See also Figure 2—source data 1. On top of scatterplots are sample images of a HH6 section with dots indicating cells expressing the corresponding marker. (K) Combination of medians of F’’, G’’, H’’ and I to illustrate difference of single (Sox2-blue, Pax7-yellow) or coexpressing cells (Sox2/Pax7-grey) at different stages. Scale bars = 20 µm. Asterisks indicate significance as calculated using a Student’s t-test with p-values displayed. Error bars indicate standard deviation.

DOI: http://dx.doi.org/10.7554/eLife.21620.003

Figure 2—source data 1. Quantification of marker coexpression in single cells.
DOI: 10.7554/eLife.21620.004

Figure 2.

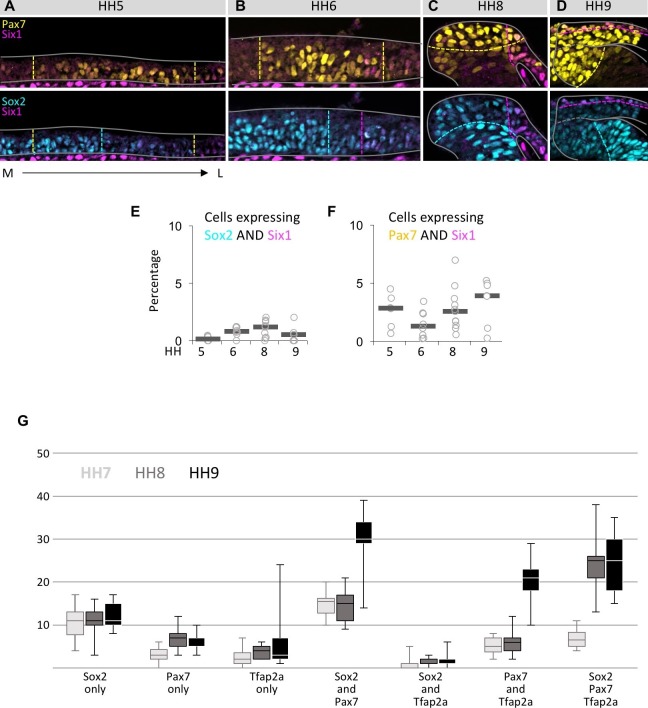
Figure 2—figure supplement 1. Coexpression of markers in single neural plate border cells.

Figure 2—figure supplement 1.

(A–D) Transverse sections immunostained for Pax7 (yellow)/Six1 (magenta) or Sox2 (blue)/Six1 (magenta) at HH5 (A), HH6 (B), HH8 (C) and HH9 (D). Grey lines outline the embryo borders. Dashed colored lines indicate borders of strong and weak/no expression of corresponding markers. Sections are oriented medial (left) to lateral (right). (E) Scatterplot of quantification of cells coexpressing Sox2 and Six1, but not Pax7 at HH5 to HH9. (F) Scatterplot of quantification of cells coexpressing Pax7 and Six1, but not Sox2 at HH5 to HH9. (G) Boxplot showing quantification of cells in the neural plate border/dorsal neural fold expressing only one of the markers examined (Sox2 only, Pax7 only, Tfap2a only) or a combination of two (Sox2/Pax7, Sox2/Tfap2a, Pax7/Tfap2a) or three markers (Sox2/Pax7/Tfap2a) at HH7 (light grey), HH8 (medium grey) to HH9 (black). For quantification, non-consecutive sections from a representative embryo were used for each stage (HH7, n = 12 sections; HH8, n = 9 sections; HH9, n = 5 sections).
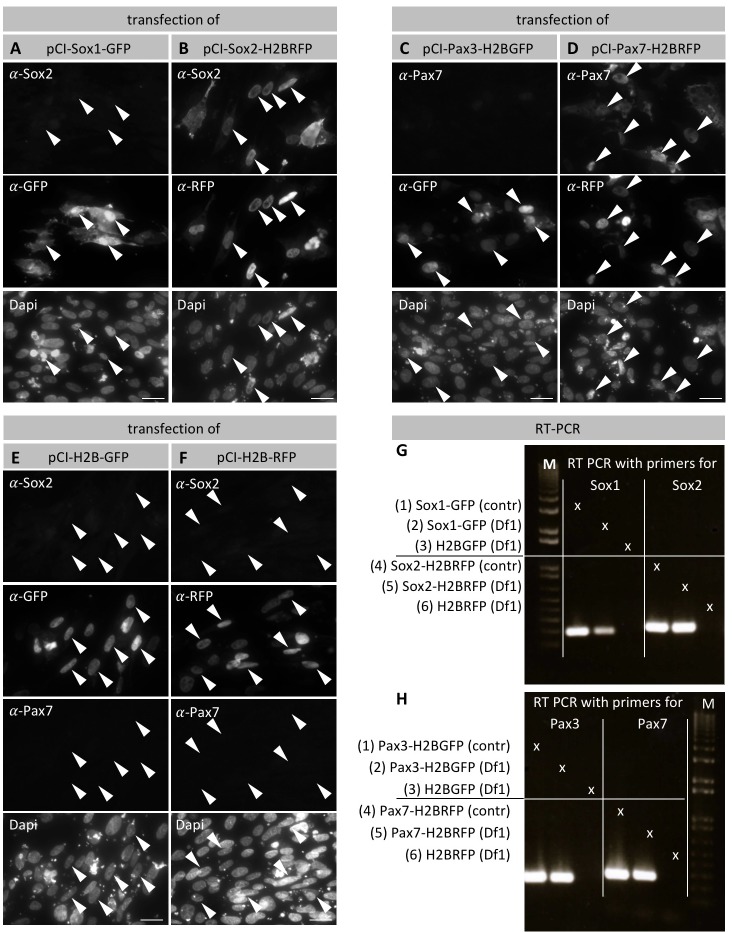
Figure 2—figure supplement 2. Specificity of Sox2 and Pax7 antibodies.

Figure 2—figure supplement 2.

(A–B) Chicken Df1 fibroblasts were transfected with pCI-Sox1-GFP (A) or pCI-Sox2H2BRFP (B) and immunostained against GFP or RFP respectively, as well as against Sox2. (A) Arrowheads point to Sox1-GFP transfected cells/nuclei that express GFP, but not Sox2. (B) Arrowheads point to Sox2-H2BRFP transfected cells that express nuclear RFP as well as Sox2. (C–D) Df1 cells transfected with pCI-Pax3-H2BGFP (C) or pCI-Pax7-H2BRFP (D), and immunostained against GFP or RFP respectively, as well as against Pax7. (C) Arrowheads point to Pax3-H2BGFP transfected cells that express nuclear GFP, but not Pax7. (D) Arrowheads point to Pax7-H2BRFP transfected cells that express nuclear RFP as well as Pax7. (E–F) Df1 cells transfected with either pCI-H2B-GFP or pCI-H2B-RFP as negative control with subsequent immunostaining against GFP/RFP respectively as well as Sox2 and Pax7. Cells transfected with either construct show strong GFP or RFP expression, but lack Sox2 and Pax7 expression. Dapi was used to visualize the cell nuclei. Scale bars equal 20 µm. (G) RT-PCR of cDNA reverse transcribed from RNA from cells transfected with either Sox1-GFP or Sox2-H2B-RFP (Line 2 and 5, respectively). As positive control plasmid DNA of pCI-Sox1-GFP (line 1) and pCI-Sox2-H2B-RFP (line 4) was used. As negative control cDNA reverse transcribed from RNA from cells transfected with either pCI-H2B-GFP (line 3) or pCI-H2B-RFP (Line 6) was used. (H) RT-PCR of cDNA reverse transcribed from RNA from cells transfected with either Pax3-H2B-GFP or Pax7-H2B-RFP (Line 2 and 5, respectively). Plasmid DNA of pCI-Pax3-H2B-GFP (line 1) and pCI-Pax7-H2B-RFP (line 4) were used as positive controls. Negative control as in (G).
Figure 2—figure supplement 3. Different Sox2 antibodies exhibit identical staining patterns.
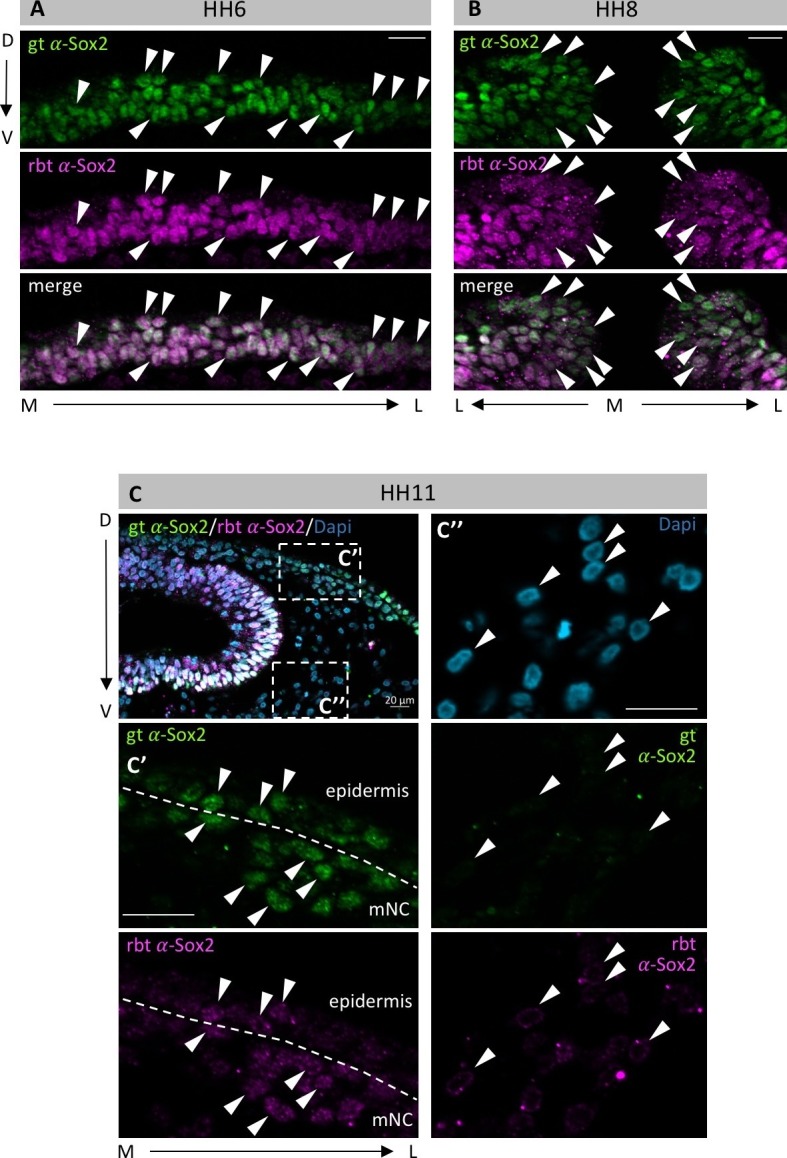
Figure 2—figure supplement 3.

Embryos at HH6 (A), HH8 (B) and HH11 (C) were co-immunostained with a goat-α-Sox2 (gt-α-Sox2, green) and a rabbit-α-Sox2 (rbt-α-Sox2, magenta) antibody in whole mount, and then sectioned. (AB) Arrowheads point to examples of nuclei that are co-stained for both antibodies. M-medial, L-lateral, D-dorsal, V-ventral. (C) white boxes indicate enlargements on (C’) and (C’’) Nuclei were counterstained with Dapi (blue). (C’) enlarged area at interface of neural crest and epidermis shows co-stained nuclei within epidermis and neural crest. (C’’) Enlarged area in mesoderm. As expected, neither goat-α-Sox2 nor rbt-α-Sox2 stain mesodermal nuclei. Scale bars = 20 µm.