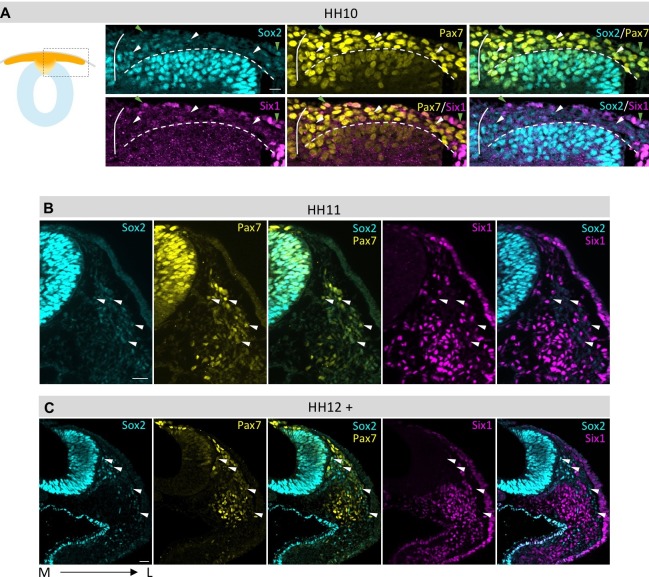
Figure 4. Comparison of Sox2, Pax7 and Six1 protein expression in dorsal neural tube and migrating neural crest.
(A–C) Sox2 protein expression compared to Pax7 and Six1. Low Sox2 levels are detectable in early (A, HH10) and late (B, HH11; C, HH12) migrating neural crest. All sections are oriented medial (left) to lateral (right). White arrowheads indicate delaminated neural crest cells that coexpress Pax7 and Sox2, but not Six1. Green arrowheads (in A) indicate epidermal cells that coexpress Pax7 and Sox2 and Six1. White line in (A) demarcates the embryonic midline and dashed line represents the border between neural tube and migrating neural crest. Scale bars = 20 µm.

