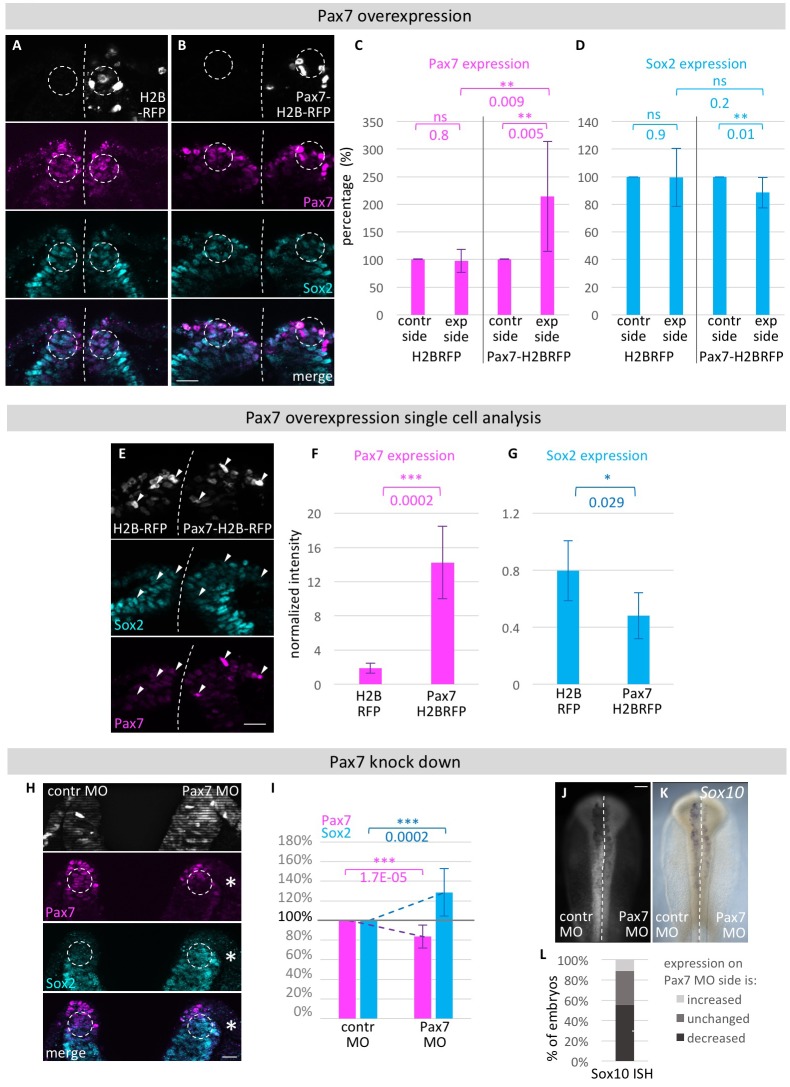
Figure 7. Functional analysis of modulating Pax7 levels.
HH4 embryos were electroporated with (A) control vector pCI-H2B-RFP or (B) pCI-Pax7-H2B-RFP on right side of embryo, then immunostained for Pax7 (magenta) and Sox2 (blue) at HH8 and transverely sectioned. Circles in dorsal neural fold indicate area of measurement for C and D. (C) Quantification of Pax7 and (D) Sox2 protein expression in dorsal neural fold after pCI-H2B-RFP or pCI-Pax7-H2B-RFP overexpression. Pax7 is increased by 115.4 ± 99.3%. Sox2 is reduced by 11.7 ± 11.2% when comparing experimental to control side. Sox2 expression in embryos with Pax7-H2B-RFP treatment on right side versus embryos with H2B-RFP treatment on right side was reduced but not to a level of statistical significance. See also Figure 7—source data 1. (E) Transversal sections of embryos electroporated with H2B-RFP on left side and Pax7-H2B-RFP on right side for single cell analysis. Quantification of (F) Pax7 and (G) Sox2 expression in single cells with very high levels of RFP expression on H2B-RFP treated side to Pax7-H2B-RFP treated side. See also Figure 7—source data 2. (H) Transversal sections of embryo electroporated with 0.5 mM Fitc-labeled Pax7 MO on right side and control MO on left side at HH4. Immunostaining for Pax7 (magenta) and Sox2 (blue). Circles in dorsal neural fold indicate area of measurement for (I). (I) Quantification of Pax7 and Sox2 protein expression in dorsal neural fold upon Pax7 knockdown. Pax7 is reduced by 16.6 ± 11.8% when comparing control to experimental side. This causes an increase of Sox2 expression by 28.6 ± 24.1%. See also Figure 7—source data 3. (J) Pax7 knock down with 0.5 mM Fitc-labeled Pax7 MO on left side or 0.5 mM Fitc-labeled control MO on right side of HH4 embryo with (G) subsequent ISH for Sox10 mRNA at HH9. Scale bar = 100 µm. (L) Quantification of decreased (dark grey), unchanged (medium grey) or increased (light grey) Sox10 mRNA expression level upon Pax7 knockdown versus control side of same embryo. See also Figure 7—source data 4. Asterisks indicate significance as calculated using a Student’s t-test. p-values are indicated in graphs. Error bars signify standard deviation.
DOI: http://dx.doi.org/10.7554/eLife.21620.025

