
Figure 3.
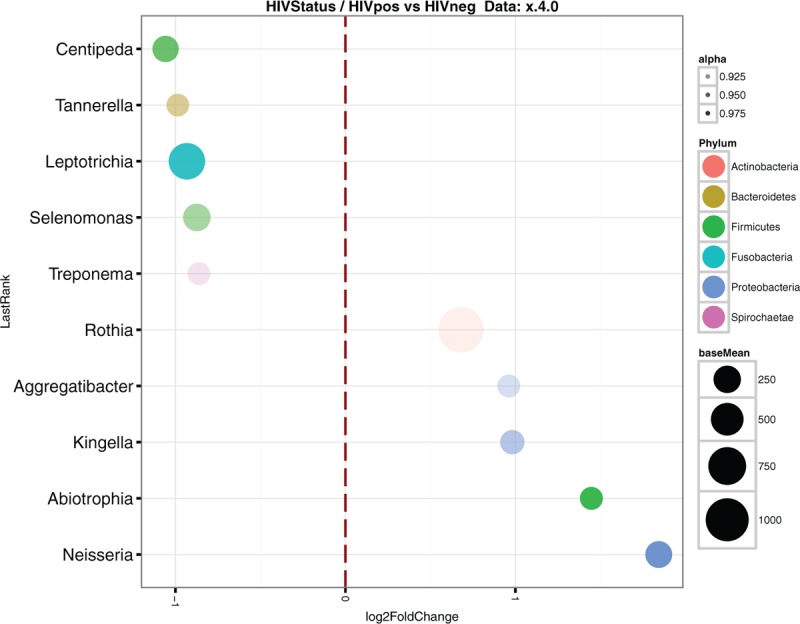
Classified differential abundant genera between HIV+ and HIV– samples. Log 2 Fold Change is plotted on the X-axis. Phyla is indicated using color codes. Point size indicates the mean count for a particular genus on the whole sample set. HIV = human immunodeficiency virus.