
Figure 2.
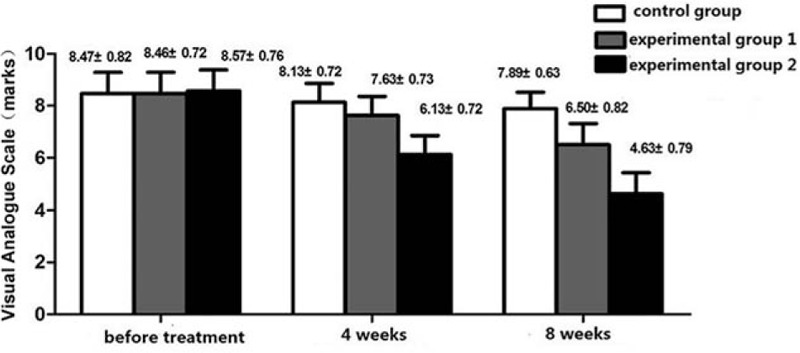
Visual analogue scale (VAS) score before treatment, 4 and 8 weeks of 3 groups (score). Application of duplicate variance analysis: test of within-subject effect, F = 393.645, P < 0.001; test of intersubject effect, F = 17.528, P < 0.001; comparison of each 2 groups, they all have difference (P < 0.05).