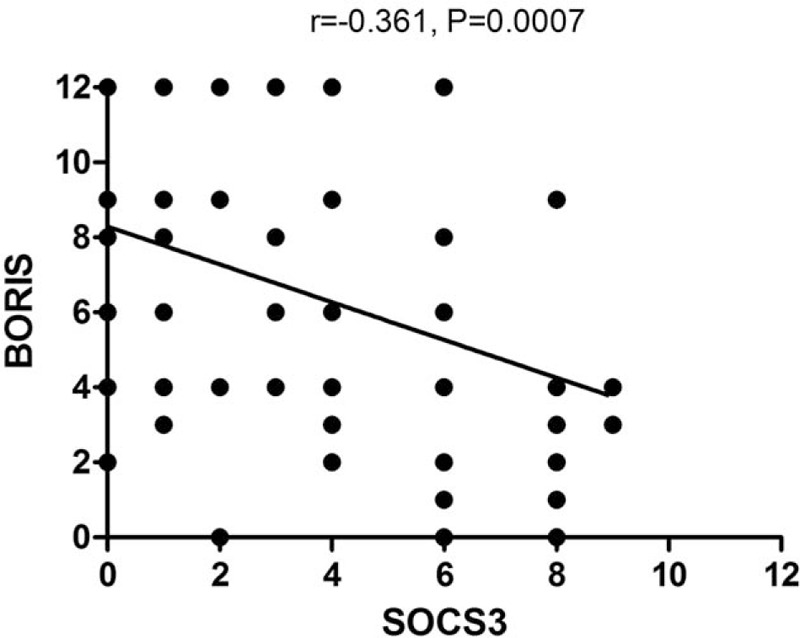
Figure 3.

Correlation between BORIS and SOCS3 expression in HCC tissue. Spearman correlation analysis of BORIS and SOCS3 expression in HCC tissue. Each point represents a tissue sample, with n = 85 cases. The BORIS level was inversely correlated with SOCS3 expression. BORIS = brother of regulator of imprinted sites, HCC = hepatocellular carcinoma, SOCS3 = suppressor of cytokine signaling 3.
