Figure 5.

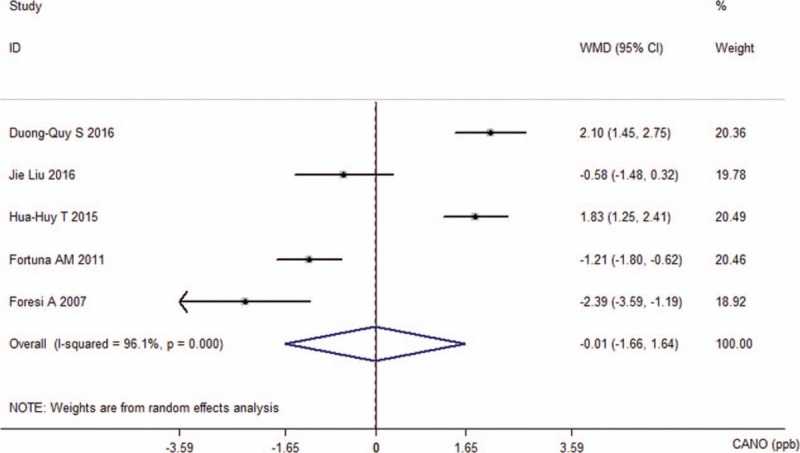
Comparison of concentration of alveolar nitric oxide between the obstructive sleep apnea groups and control groups in the 5 included studies.

Comparison of concentration of alveolar nitric oxide between the obstructive sleep apnea groups and control groups in the 5 included studies.