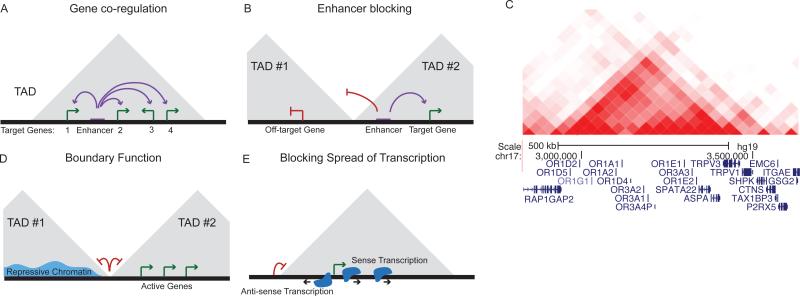
Figure 3. Function of TADs in genome regulation.
A) Example diagram showing the co-regulation of multiple genes by a single regulatory element within a TAD. B) Interaction heat map showing a single TAD encompassing a cluster of olfactory receptor genes (data from Dixon et al. 2015) C) Diagram of the potential for TAD boundaries to serve an enhancer blocking role that restricts enhancers to target genes within the same TAD. D) Diagram of the potential for TAD boundaries to restrict the spread of repressive chromatin into active domains and vice versa. E) Diagram of the role of TADs in forming a barrier to divergent transcriptional “noise” in the genome.

