
Figure 2.
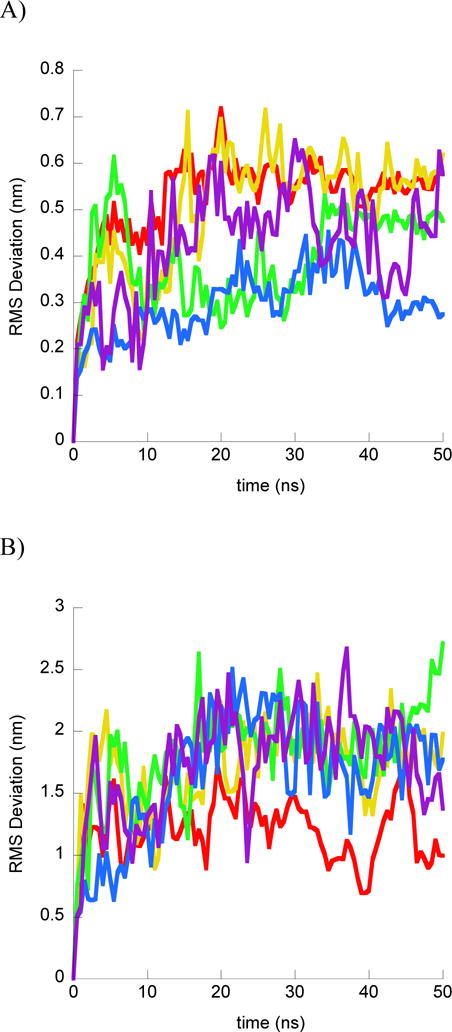
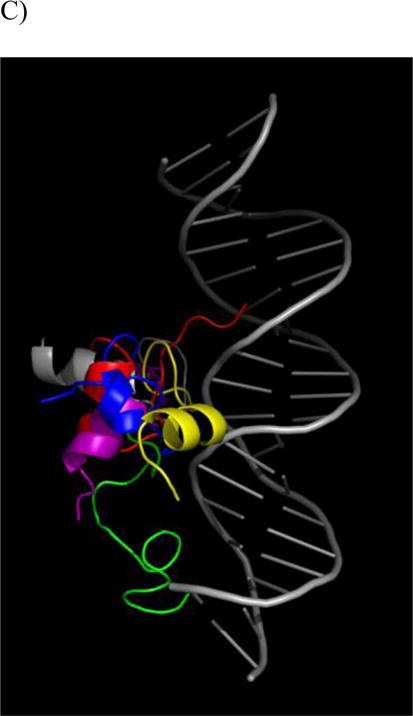
Structural results from DesHDAP1•DNA simulations. For each part simulations shown as different color: simulation 1 (red); simulation 2 (yellow); simulation 3 (green); simulation 4 (blue); simulation 5 (purple). A) RMS deviation of DesHDAP1 Cα from the initial peptide structure when structures at simulation frames were superimposed with the initial peptide structure. B) DesHDAP1 deviation of BF2 Cα from the initial peptide structure when structures at simulation frames were superimposed with the initial DNA backbone structure. C) Final DesHDAP1 structures from each simulation and the initial DesHDAP1 structure. All structures superimposed on the initial DNA backbone. Peptide and DNA are shown as backbone ribbons with water and ions omitted for clarity.