
Figure 5.
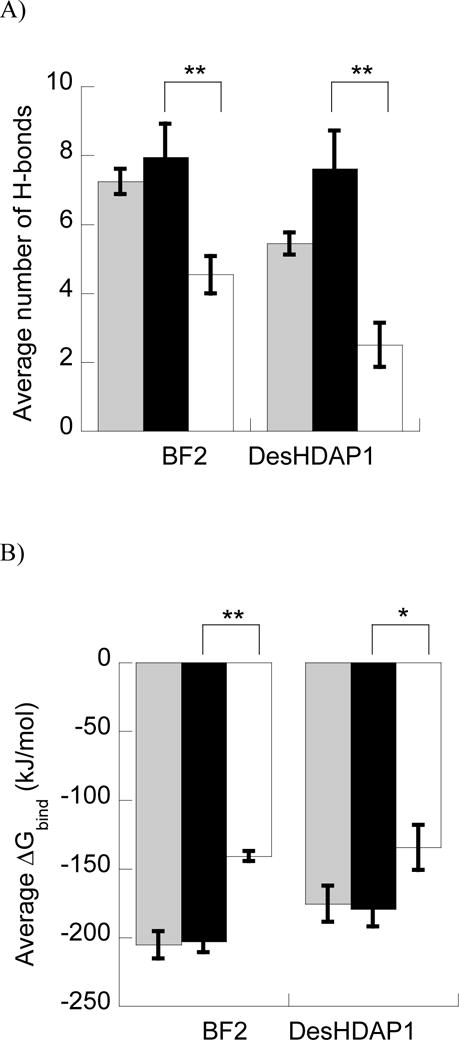
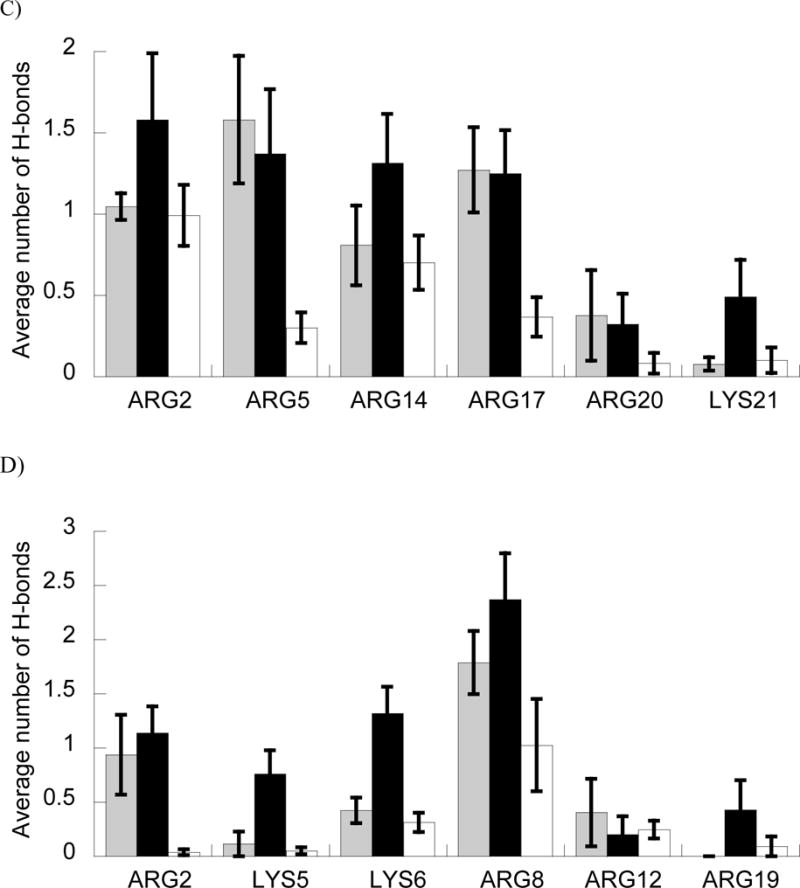
A and B) Average number of H-bonds (A) and ΔGbind (B) between BF2 and DesHDAP1 wild type (gray), arginine (black) and lysine (white) variants and DNA in MD simulations. * denotes p<0.05 and ** denotes p<0.01 for t-test comparisons of arginine and lysine variants of a peptide. C and D) Average number of peptide•DNA H-bonds for each cationic residue in simulations of wild type, arginine (black) and lysine (white) simulations of BF2 (C) and DesHDAP1 (D). Residue names correspond to the wild type peptides. Averages for each simulation determined over the last 10 ns, with the error bars shown as the standard error from averaging values from the five simulations.