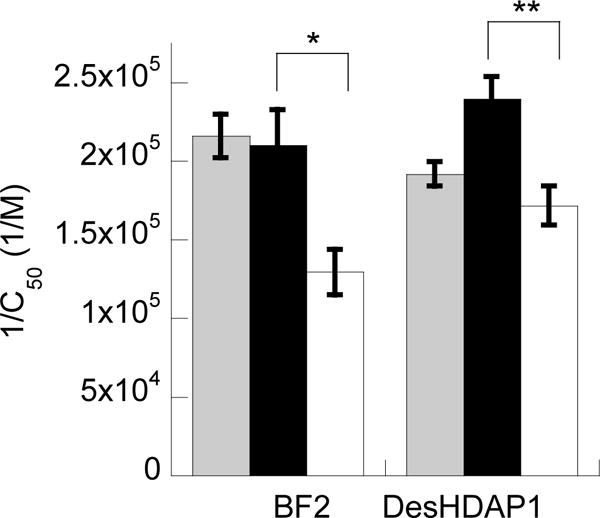
Figure 6.

Experimentally measured relative binding constants, expressed as 1/C50, for BF2 and DesHDAP1 wild type (gray), arginine (black) and lysine (white) variants with the H2A-15 DNA sequence (Table 1). All data reported is averaged from at least three independent binding experiments with error bars shown as standard error. * denotes p<0.05 and ** denotes p<0.01 for t-test comparisons of arginine and lysine variants of a peptide.
