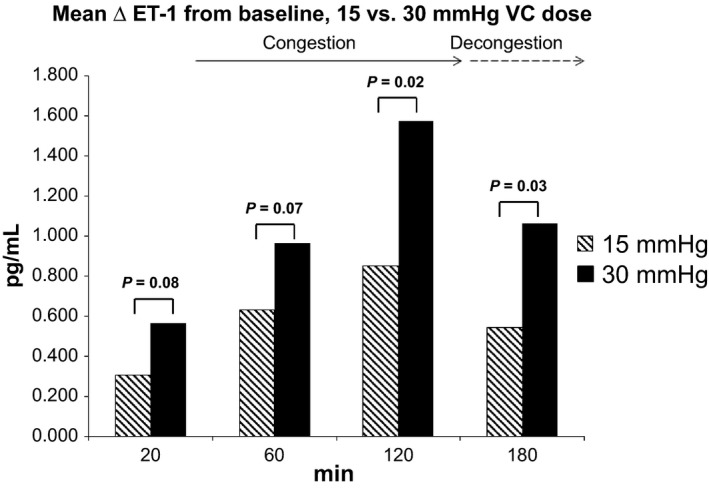
Figure 2.

Plasma endothelin‐1 changes from baseline according to time and venous congestion (VC) dose. Change is computed as endothelin‐1 differences between each time point and baseline levels in the test arm; 30 mmHg data at 180 min in the test arm are based on a sample of 18 subjects; 15 mmHg data at 60 min in the control arm are based on a sample of 19 subjects.
