
Figure 5.
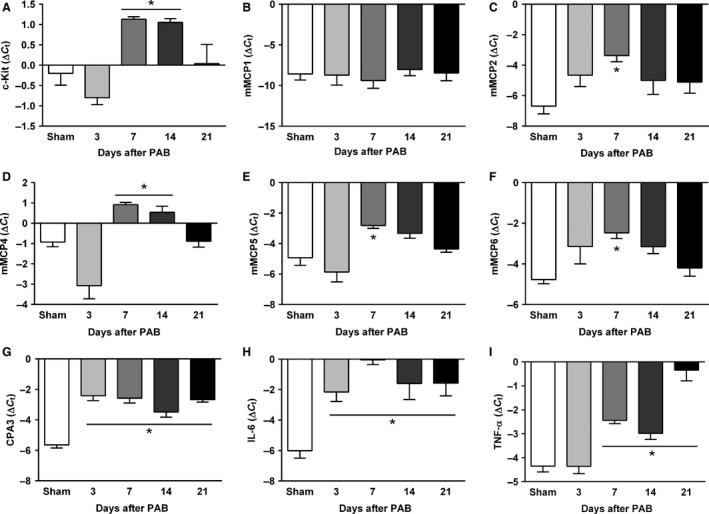
Time course of the right ventricular mRNA gene expression analysis of genes related to mast cells (A–G) and inflammation (H and I) in sham and PAB mice. (A) c‐Kit. (B) Murine mast cell protease (mMCP)‐1. (C) mMCP2. (D) mMCP4. (E) mMCP5. (F) mMCP6. (G) carboxypeptidase‐3 (CPA3). (H) IL‐6. (I) TNF‐α. Values are means ± SEM. *P < 0.05 versus sham at corresponding time points, n = 5 mice per group. PAB, pulmonary artery banding.