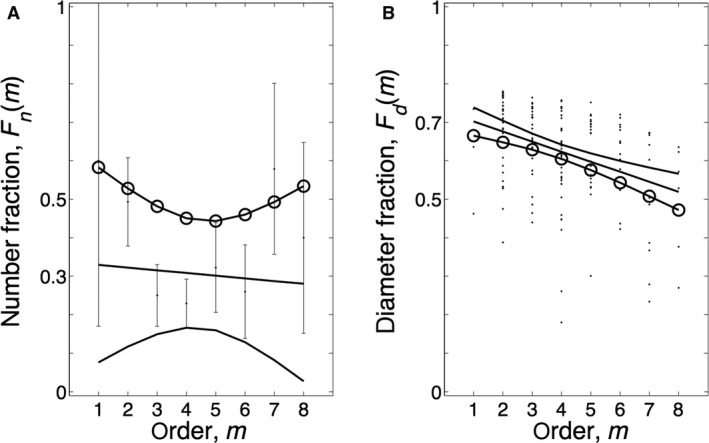
Figure 6.

Number and diameter fractions per order. (A) Number fractions F n(m) as function of order. (B) Diameter fractions of the vessels F d(m) per order. The regression lines with their 95% confidence intervals are shown. The slope of F n(m) is not significant (P = 0.70); the slope of F d(m) is significant (P < 0.0001). The circles on the upper and lower confidence limits indicate the values of F n(m) and F d(m) that predict the worst case that a maximal number of vessels are involved with a minimal inner diameter, thereby contributing maximally to the resistance increase.
