
Figure 8.
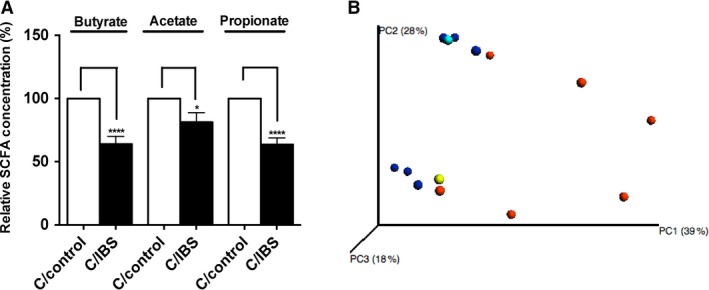
Microbial community metabolism in Germ‐free mice recipients of control and IBS‐C samples 4 weeks postcolonization shows significant differences between two groups. (A) SCFA relative concentrations in cecal microbiota from mice colonized with IBS‐C and control microbiota. (B) PCoA analysis of community metabolism using Biolog of IBS‐C and control recipients. Values are expressed as percentage of SCFA levels in cecal contents obtained from control mice, n = 13 mice per group, *P < 0.05, ****P < 0.0001. SCFA, short‐chain fatty acids.