
Figure 5.
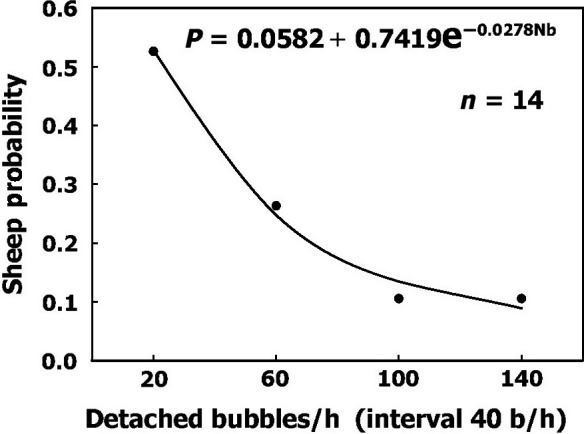
Frequency of sheep having various levels of bubble production after decompression. An exponential function was used to fit the data.
Official websites use .gov
A
.gov website belongs to an official
government organization in the United States.
Secure .gov websites use HTTPS
A lock (
) or https:// means you've safely
connected to the .gov website. Share sensitive
information only on official, secure websites.
Frequency of sheep having various levels of bubble production after decompression. An exponential function was used to fit the data.